

Which Statistical Test Should I Use? The 2026 Decision Guide for Dissertations
Almost nobody picks a statistical test from first principles. They pick the one their supervisor mentioned, or the one in the textbook chapter they read most recently, and then hope the data cooperate.
It is a genuinely answerable question, though, and it takes four steps. Work through them in order and the test selects itself.
The four questions that decide everything
1. What kind of question are you asking?
There are three, and they are not interchangeable:
- Difference — do these groups differ on this measure?
- Association — do these two variables move together?
- Prediction — can I estimate this outcome from these predictors?
Write your research question out in full and identify which of the three verbs it uses. Most confusion at this stage comes from questions that quietly contain two, in which case you need two analyses, not one compromise.
2. What is the measurement level of your outcome variable?

- Nominal — unordered categories. Degree subject, employment status, yes/no.
- Ordinal — ordered categories with uneven or unknown gaps. A single Likert item, a satisfaction band, a degree classification.
- Interval or ratio — genuine numbers with equal intervals. Test scores, age, income, reaction time.
The recurring hard case is Likert data. A single item is ordinal. A scale score made by summing or averaging several items is conventionally treated as continuous, and that treatment should be stated and justified in your methodology — see the guide to designing a Likert scale questionnaire.
3. How many groups, and are they independent or related?
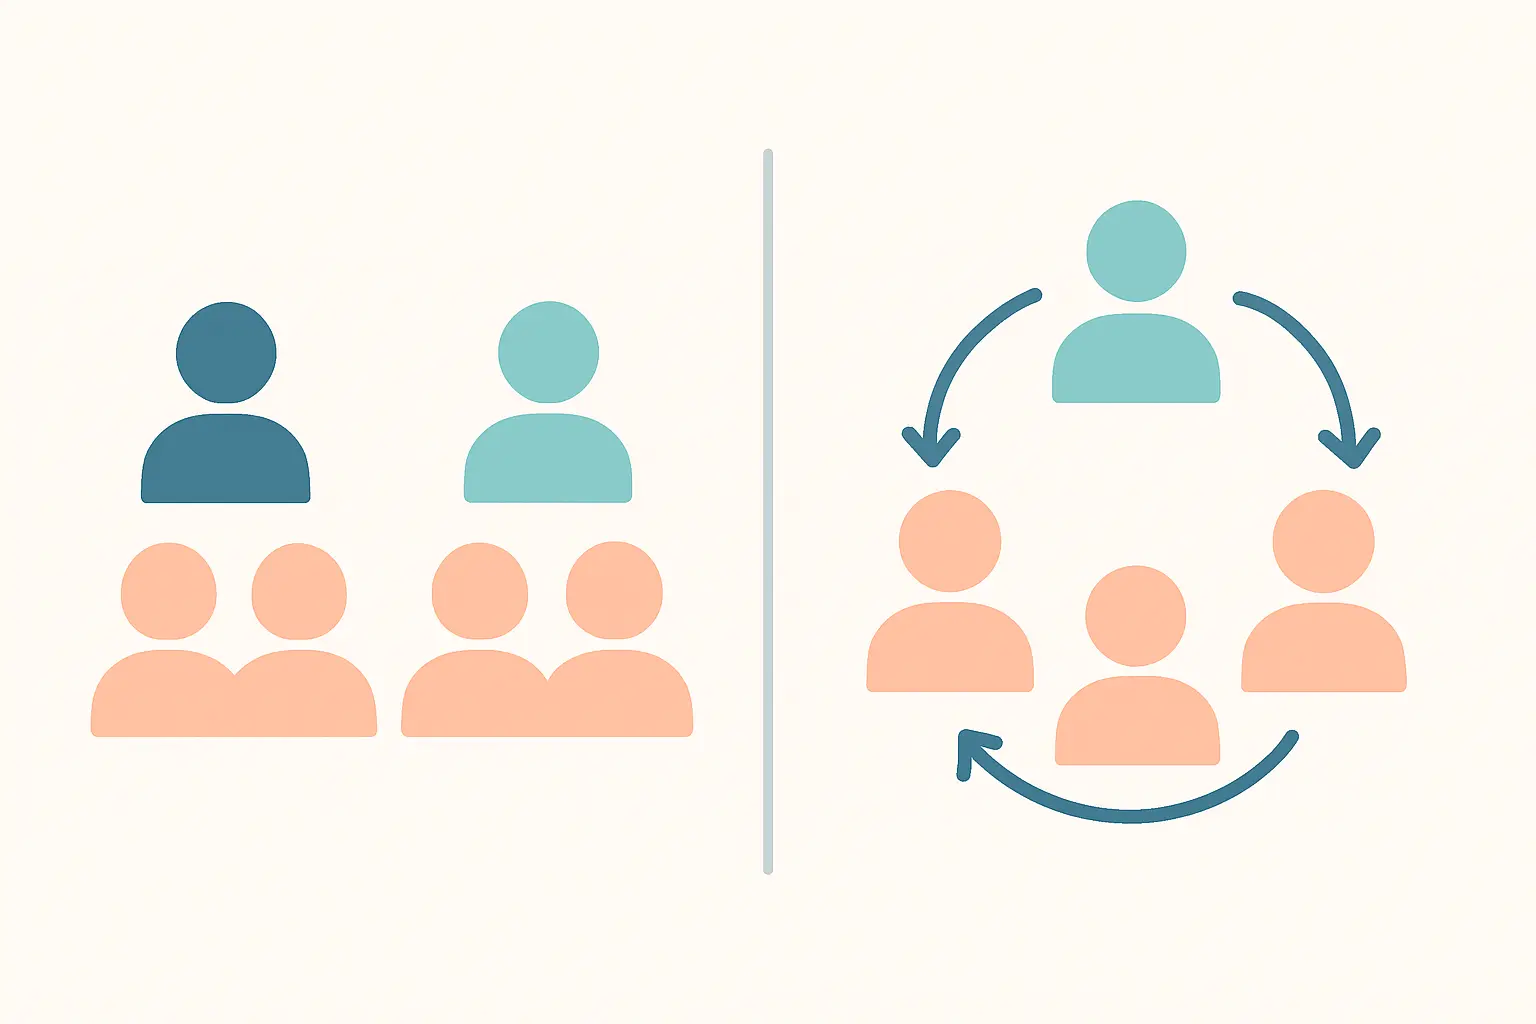
Count the groups or measurement occasions — one, two, or three-plus — and establish whether the same participants appear in more than one. If each person contributes a single score, the design is independent. If the same people are measured before and after, or under two conditions, it is related (also called paired or repeated measures). Matched pairs count as related.
Getting this wrong is expensive in both directions. Treating related data as independent discards the pairing and loses statistical power; treating independent data as related is simply invalid.
4. Do the parametric assumptions hold?
Parametric tests generally require an interval or ratio outcome, approximately normal distributions within groups, and reasonably similar variances across groups. When those hold, use the parametric test — it is more powerful. When they do not, the rank-based equivalent in the final column of the table below is the answer. The full logic is set out in the guide to non-parametric tests.
The selection matrix
| Your question | Outcome | Design | Parametric test | Non-parametric equivalent |
|---|---|---|---|---|
| Difference | Continuous | One sample vs a known value | One-sample t-test | One-sample Wilcoxon |
| Difference | Continuous | 2 independent groups | Independent samples t-test | Mann-Whitney U |
| Difference | Continuous | 2 related measures | Paired samples t-test | Wilcoxon signed-rank |
| Difference | Continuous | 3+ independent groups | One-way ANOVA | Kruskal-Wallis H |
| Difference | Continuous | 3+ related measures | Repeated measures ANOVA | Friedman test |
| Difference | Categorical | 2+ independent groups | Chi-square test of independence | Fisher’s exact test (small cells) |
| Association | Two continuous | One sample | Pearson’s r | Spearman’s rho or Kendall’s tau-b |
| Association | Two categorical | One sample | Chi-square, with Cramer’s V | — |
| Prediction | Continuous | Any predictors | Linear / multiple regression | — |
| Prediction | Binary | Any predictors | Binary logistic regression | — |
| Prediction | Ordered categories | Any predictors | Ordinal logistic regression | — |
| Prediction | Counts | Any predictors | Poisson / negative binomial | — |
The tests, one by one
1. Independent samples t-test. Two separate groups, one continuous outcome. Report both group means and standard deviations, t with degrees of freedom, an exact p-value, Cohen’s d and a confidence interval. Practical tip: Levene’s test inside the output decides which of the two result rows you read. Full walkthrough: how to run an independent samples t-test in SPSS.
2. Paired samples t-test. One group measured twice. Report the mean difference rather than the two separate means, because the difference is what the test analyses. Practical tip: the pairing must be intact in your data file — one row per participant, two columns.
3. One-way ANOVA. Three or more independent groups. A significant F tells you the groups are not all alike but not which differ, so a post-hoc test is required. Practical tip: never substitute several t-tests, which inflates the false-positive rate. Full walkthrough: how to run an ANOVA in SPSS.
4. Mann-Whitney U. The rank-based stand-in for the independent t-test, for ordinal outcomes or badly skewed data. Practical tip: report medians and interquartile ranges, not means.
5. Kruskal-Wallis H. The rank-based stand-in for one-way ANOVA. Practical tip: like ANOVA it needs a follow-up to locate the difference, with an adjustment for multiple comparisons.
6. Wilcoxon signed-rank. The rank-based stand-in for the paired t-test. Practical tip: it tests the ranks of the differences, so it is unaffected by a few extreme change scores.
7. Chi-square test of independence. Two categorical variables, testing whether the distribution across one depends on the other. Practical tip: check expected cell counts — if more than a fifth fall below 5, use Fisher’s exact test instead, and report Cramer’s V as the effect size. Full walkthrough: how to run a chi-square test in SPSS.
8. Pearson’s r and Spearman’s rho. Association between two variables, with no predictor and no outcome. Practical tip: plot the scatterplot before you read the coefficient — one number cannot show you a curve or an outlier. Full walkthrough: how to run a correlation in SPSS.
9. Multiple regression. Predicting a continuous outcome from several predictors at once, each adjusted for the others. Practical tip: the assumption checks are the part that gets marked, not the R². Full walkthrough: how to run a multiple regression in SPSS.
10. Binary logistic regression. Predicting a two-category outcome. Practical tip: the sample size constraint is the number of events in the smaller category, not your total N. Full comparison: linear vs logistic regression.
11. Structural equation modelling. For testing a whole network of relationships between latent constructs at once, rather than one link at a time. Practical tip: this is a modelling framework, not a single test, and it needs a substantially larger sample. Overview: structural equation modelling explained.
12. Mediation and moderation analysis. For questions about why or when an effect occurs rather than whether it exists. Practical tip: these are specified in advance from theory, not discovered by trying combinations. Overview: mediation and moderation analysis.
Five mistakes this table is designed to prevent
- Running multiple t-tests instead of an ANOVA. Three groups tested pairwise carries roughly a 14 per cent chance of at least one false positive rather than 5 per cent.
- Running linear regression on a binary outcome. It produces coefficients and no warning, and every assumption underpinning the p-values has failed.
- Treating related measures as independent. Pre and post scores from the same people are paired data; analysing them as two groups throws away the design.
- Dichotomising a continuous outcome to make it fit a simpler test. It discards information and reduces power for no analytic gain.
- Choosing the test after seeing which gives a significant result. The test follows from the question and the data structure, both of which are fixed before the analysis begins.
Before you run anything
Three checks belong ahead of the analysis, not after it. Confirm your sample is large enough to detect the effect you expect, using the G*Power guide. Decide how missing values will be handled and record the rule, following the missing data walkthrough. And plan which effect size you will report, because APA 7 requires one for every test — see effect sizes and confidence intervals.
Frequently asked questions
What if my data are not normally distributed?
Take the non-parametric equivalent from the final column of the matrix. With larger groups the parametric tests tolerate moderate departures, so mild skew is not automatically disqualifying — but a small, badly skewed group is.
Can I use a parametric test on Likert data?
For a composite scale score, conventionally yes, and you should say so and justify it. For a single item, use the ordinal route: Mann-Whitney, Kruskal-Wallis or Spearman.
My outcome is continuous but my predictors are categorical. Which is it?
If you have one categorical predictor with two or three-plus levels, that is a t-test or an ANOVA. If you have several predictors of mixed type, that is multiple regression with the categorical ones dummy-coded — the two approaches are closely related and both are legitimate.
Do I need to test for normality first?
Inspect the distribution, but do not let a significance test alone decide. Shapiro-Wilk flags trivial departures as significant in large samples and misses real ones in small samples. Histograms, Q-Q plots and the size of your groups together give a better answer.
What if none of these fit my design?
Common reasons are nested data, repeated measures with missing occasions, or time-to-event outcomes. Each has a specific model, and the honest move is to name the complication in your methodology and take it to your supervisor early rather than forcing it into a simpler test.
Can I run more than one test on the same data?
Yes, if each answers a distinct research question stated in advance. What is not acceptable is running many tests and reporting only those that reached significance.
Using this guide
The order matters more than the memorising. Question type, then measurement level, then design, then assumptions — four answers, and the matrix gives you one test and one non-parametric fallback. Everything after that is procedure, and each procedure is linked above.
For the wider methodological context, the quantitative research methods guide covers how the design decisions upstream of this table are made. And when the analysis is done and the results chapter is the obstacle, Tesify turns your output into a structured APA 7 write-up with the notation and hedging already correct.
Write your thesis with AI
Structure, draft, cite, and format your thesis faster with Tesify’s AI writing tools, automatic bibliography, and plagiarism checker. Free to start, no credit card required.






Leave a Reply