

Mediation and Moderation Analysis Explained in 2026: PROCESS, Baron & Kenny, and How to Tell Them Apart
When your supervisor asks whether the relationship between two variables is explained by a third variable or depends on a third variable, you are facing one of the most consequential decisions in quantitative research design — a question about mediation and moderation analysis. The distinction sounds deceptively simple. In practice it trips up a substantial proportion of dissertation students and early-career researchers, because both analyses use ordinary regression machinery while answering fundamentally different theoretical questions and requiring different inferential tests.
This guide covers the conceptual logic of both analyses; the Baron & Kenny (1986) causal steps procedure and why contemporary methodologists no longer consider it sufficient alone; the bootstrap-based approach that has replaced it; Hayes’ PROCESS macro templates (models 1 and 4 and moderated mediation); how to write up results in APA 7; and the recurring errors that examiners flag in dissertation statistics chapters. All numerical examples presented in this article are illustrative only and do not derive from an empirical published study.
The conceptual difference: mechanism versus condition
The fastest way to separate mediation from moderation is to ask what theoretical role the third variable plays in your research model.
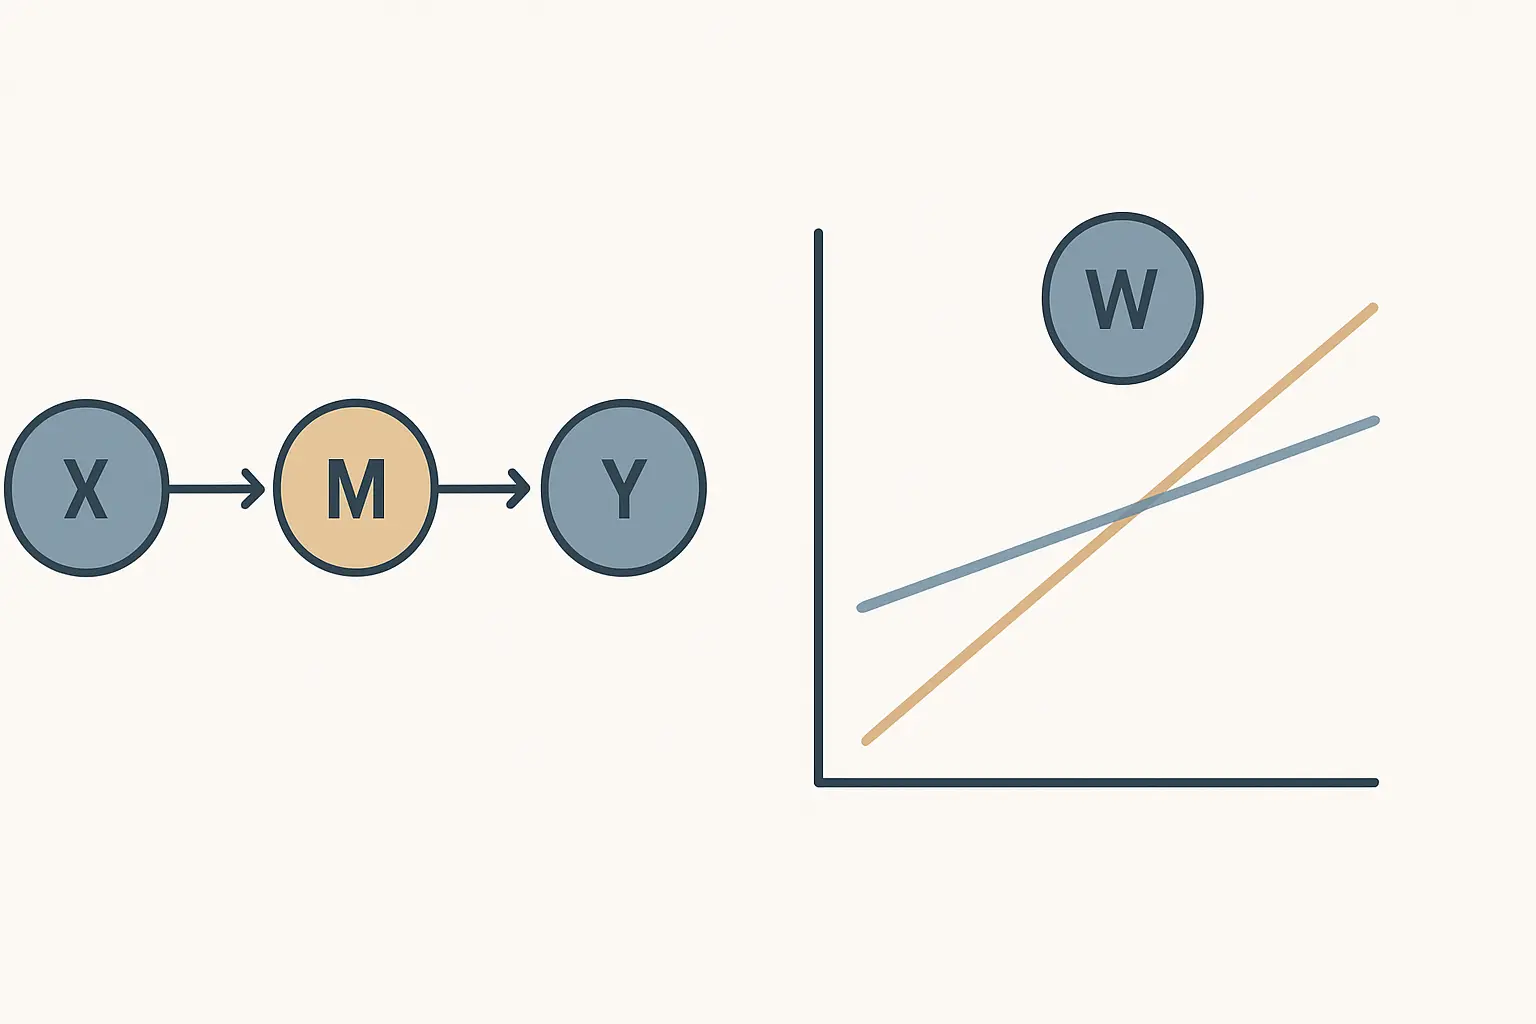
Mediation posits that X affects Y through M. The mediator M is the causal mechanism — the pathway through which X transmits its influence to Y. If you were to block M, the effect of X on Y should diminish or disappear. The hallmark quantity is the indirect effect, computed as the product of path a (X predicting M) and path b (M predicting Y, controlling for X), written a × b. The remaining direct effect of X on Y, controlling for M, is labelled c′. Two examples: exercise (X) reduces depressive symptoms (Y) partly because it increases self-efficacy (M); a training programme (X) improves sales performance (Y) because it builds product knowledge (M).
Moderation posits that the relationship between X and Y is not constant — it varies in strength or direction depending on the value of a moderator W. This is an interaction effect, logically identical to the interaction term in ANOVA. If the product term X × W significantly predicts Y (above and beyond the main effects of X and W), moderation is present. Example: the effect of critical feedback (X) on learning outcomes (Y) is stronger for students high in growth mindset (W) than for those low in growth mindset.
| Feature | Mediation | Moderation |
|---|---|---|
| Core question | How / why does X affect Y? | When / for whom does X affect Y? |
| Third-variable role | Mechanism (M on causal path) | Boundary condition (W modifies slope) |
| Key estimand | Indirect effect a × b | Interaction term X × W |
| Temporal assumption | M follows X, precedes Y | W can be measured at any point |
| PROCESS model | Model 4 (simple mediation) | Model 1 (simple moderation) |
A practical diagnostic: if you can replace “through” with “depending on” and your sentence retains coherent theoretical meaning, you may be conflating the two. “Training improves performance through skill-building” = mediation. “Training improves performance depending on motivation level” = moderation. Same predictor, same outcome, entirely different analytical structures.
Baron & Kenny (1986): the four causal steps
Baron and Kenny’s 1986 paper in the Journal of Personality and Social Psychology — “The Moderator-Mediator Variable Distinction in Social Psychological Research: Conceptual, Strategic, and Statistical Considerations” — established the vocabulary and testing procedure that dominated mediation research for two decades. Their causal steps approach requires four conditions to be satisfied before claiming mediation:
- Step 1 (path c, the total effect): X must significantly predict Y in a simple regression. This establishes that there is a total effect worth decomposing.
- Step 2 (path a): X must significantly predict the mediator M in a separate regression.
- Step 3 (path b): M must significantly predict Y when X is also in the model — that is, controlling for the predictor — confirming that M carries unique variance in the outcome.
- Step 4: The effect of X on Y (now the direct effect c′, after controlling for M) must be reduced relative to c. If c′ drops to non-significance, Baron and Kenny labelled this full mediation; if it remains significant but smaller, they called it partial mediation.
To formally test whether the indirect effect a × b was significant, Baron and Kenny referenced the Sobel test — a z-statistic derived from the product of paths a and b and their standard errors. The procedure was adopted almost universally through the 1990s and into the 2000s because three regression equations could be estimated in any standard software package, the logic was pedagogically transparent, and the required statistics appeared routinely in output.
Why the causal steps are no longer sufficient
Despite their widespread use, the four causal steps attracted serious methodological critique across several dimensions. The criticisms are now broadly accepted in the quantitative methods literature.
Step 1 is an unnecessary prerequisite
Requiring the total effect c to be statistically significant before testing mediation is needlessly conservative. An indirect effect (a × b) can be substantial while the total effect c hovers near zero — because the direct effect c′ operates in the opposite direction, partially cancelling the indirect pathway. This pattern, sometimes called inconsistent mediation or suppression, is theoretically interpretable and methodologically legitimate. Treating Step 1 failure as grounds to abandon the analysis causes researchers to miss real indirect effects. David Kenny himself later clarified on his website that Step 1 is not a necessary condition for mediation.
The Sobel test assumes normality of the indirect effect
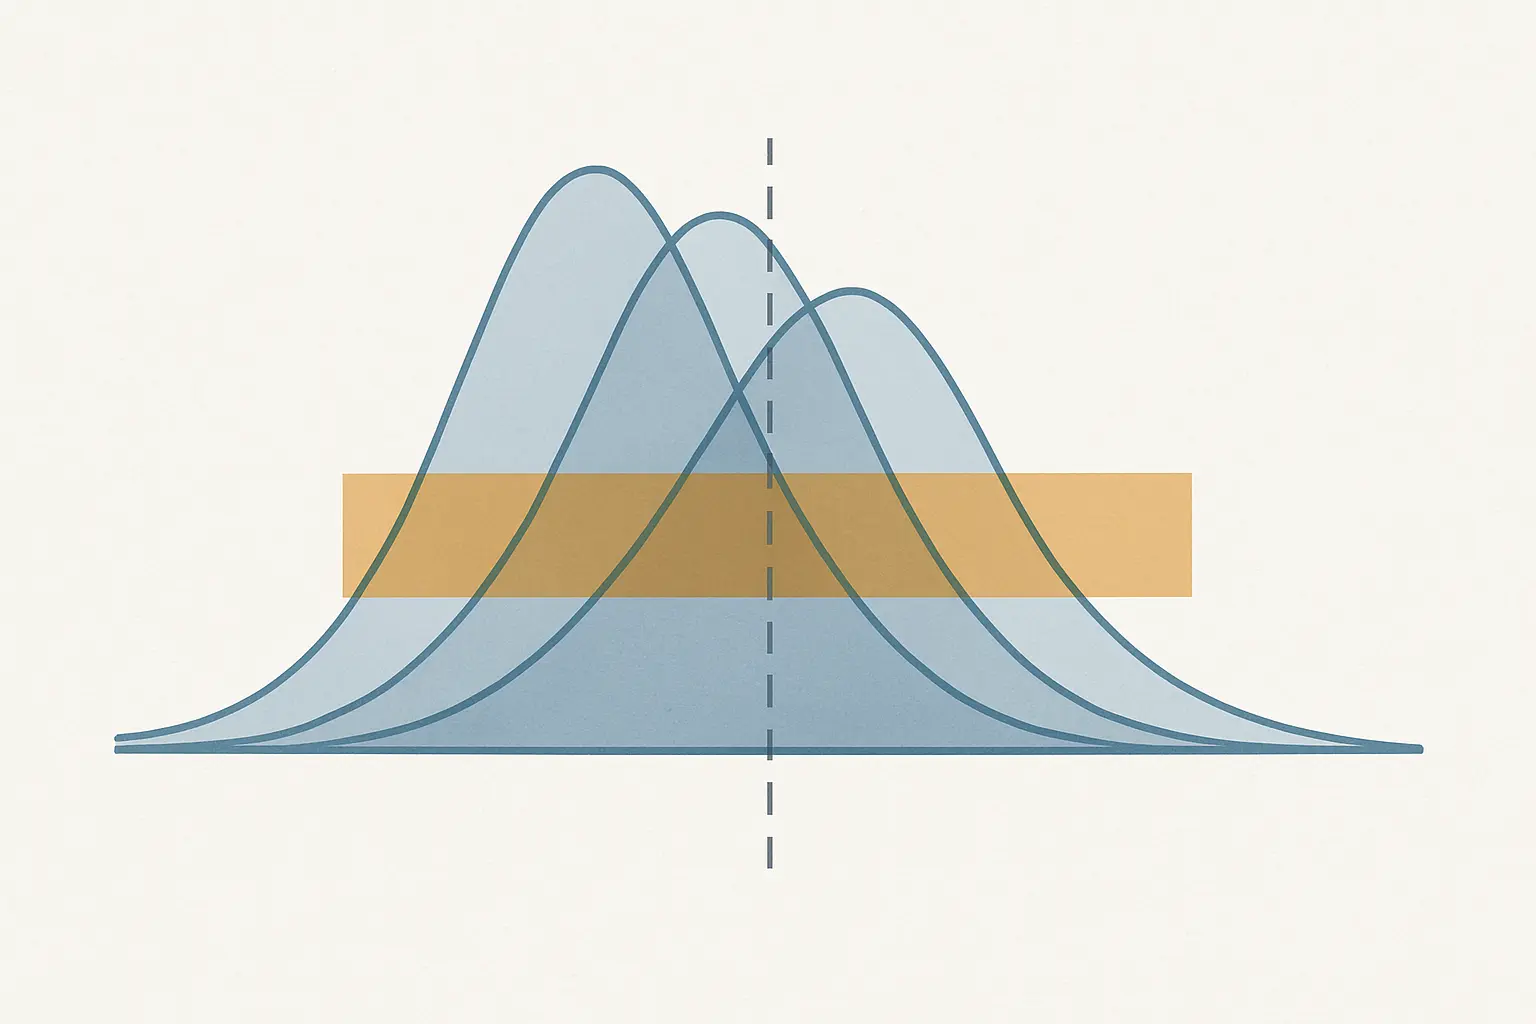
The Sobel test treats a × b as if it were drawn from a normal distribution. This assumption is routinely violated: the sampling distribution of a product of two regression coefficients is almost always asymmetric, often substantially so, particularly with smaller samples. A symmetric test statistic cannot accurately bound an asymmetric quantity. In consequence, the Sobel test is systematically underpowered — it misses genuine indirect effects — and can produce misleading p-values in both directions.
Full versus partial mediation is a problematic binary
Labelling mediation as “full” or “partial” implies that a surviving direct effect represents theoretical failure. In practice, direct effects frequently carry genuine independent meaning. The contemporary focus falls on the size of the indirect effect and the proportion of the total effect that is mediated (PM = ab/c), not on whether the direct effect survives a significance threshold.
Cross-sectional designs cannot establish causal order
The four steps identify statistical patterns; they do not establish the temporal or causal ordering X → M → Y. This limitation is not specific to Baron and Kenny — it applies to all mediation analysis with observational cross-sectional data. The causal inference literature (in particular the potential outcomes framework developed by Imai, Keele, & Tingley, 2010) formalises what assumptions must hold for a regression-estimated indirect effect to be interpretable as causal, and those assumptions are strong and often untestable.
Bootstrapping the indirect effect
Preacher and Hayes (2004, 2008) popularised a resampling strategy that bypasses the normality assumption of the Sobel test entirely. The bootstrap procedure is conceptually straightforward:
- Draw a random sample from your observed data with replacement, the same size as the original dataset.
- Estimate paths a and b in that resampled dataset and compute the indirect effect a × b.
- Repeat this process across many resamples — Hayes recommends at least 5,000; methodologists sometimes use 10,000 for publication-quality estimates.
- From the empirical distribution of a × b values, take the 2.5th and 97.5th percentiles to form a 95% confidence interval (the percentile bootstrap CI). The bias-corrected and accelerated (BCa) variant adjusts for skewness and bias in the bootstrap distribution and is often preferred.
- If the confidence interval does not include zero, the indirect effect is significant at α = .05.
Because the bootstrap derives its reference distribution empirically from the data rather than from a theoretical normal distribution, it naturally accommodates the asymmetry of the sampling distribution of a × b. Simulation studies comparing inferential methods for indirect effects have consistently found that bootstrapped confidence intervals — particularly the BCa variant — outperform the Sobel test in statistical power while maintaining appropriate Type I error rates across a range of sample sizes and model configurations.
Hayes PROCESS macro: models 1, 4, and beyond
Andrew Hayes’ PROCESS macro (Hayes, 2022, 3rd edition) is a free add-in for SPSS and SAS that can also be run in R. It estimates conditional process models using ordinary least squares (OLS) regression — and therefore makes the same distributional assumptions as standard regression — while providing bootstrap confidence intervals for indirect effects automatically. The macro assigns numbered templates to common model configurations; researchers select a model number rather than writing multi-equation syntax from scratch.
Model 4: Simple mediation
Model 4 is the most widely requested configuration. It corresponds to the Baron and Kenny mediation framework updated to use bootstrapping rather than the Sobel test. PROCESS estimates two regression equations simultaneously:
- Equation 1: M = i₁ + aX + e₁ — X predicting the mediator.
- Equation 2: Y = i₂ + c′X + bM + e₂ — X and M jointly predicting the outcome.
The macro then computes the indirect effect a × b, generates the bootstrap CI, and reports the total effect c, the direct effect c′, and model R² for each equation. The output also flags whether each path coefficient is statistically significant, though the test of mediation rests on the CI for the indirect effect, not on the sequential significance of individual paths.
Model 1: Simple moderation
Model 1 tests whether the relationship between X and Y changes as a function of moderator W. It estimates a single regression equation:
- Y = i + b₁X + b₂W + b₃(X × W) + e
The interaction coefficient b₃ is the focal parameter. PROCESS automatically mean-centres X and W before computing the product term, which reduces the multicollinearity that arises between main effects and the interaction without altering the interpretation of b₃. If b₃ is significant, PROCESS probes the interaction by computing conditional slopes of X on Y at representative values of W — by default, the mean and ±1 standard deviation. The Johnson–Neyman technique, also included in the PROCESS output for Model 1, identifies the precise range of W values within which the simple slope of X is and is not statistically significant, avoiding the arbitrariness of the mean-±-SD convention.
Moderated mediation: conditional process models
When the theoretical question involves both mediation and moderation simultaneously — does the indirect effect of X on Y through M vary as a function of a moderator W? — the analysis is called a conditional process model or moderated mediation. Hayes covers more than 92 model templates in PROCESS. The most commonly used configurations are:
- Model 7: W moderates the a path (X → M); the b path (M → Y) is constant across W.
- Model 14: W moderates the b path (M → Y); the a path is constant.
- Model 58 / 59: W moderates both the a path and the b path simultaneously (the most general form).
The key estimand in moderated mediation is the index of moderated mediation (Hayes, 2015): a single coefficient quantifying how much the indirect effect changes per one-unit increase in W. PROCESS reports this index with a bootstrap CI. If the CI excludes zero, moderated mediation is supported — the indirect effect operates at a statistically different magnitude or direction across levels of W.
For research involving latent constructs measured across multiple indicators, mediation models are often better specified within structural equation modeling (SEM). SEM accounts for measurement error in the mediator explicitly, which attenuates bias in path coefficient estimates when M is not perfectly reliable. PROCESS treats all variables as observed without error; this is adequate when measurement quality is high, but can introduce downward bias in path b when the mediator is measured with modest reliability.
How to report results in APA 7
APA 7 does not prescribe a single template for mediation or moderation reporting, but the field has converged on minimum required elements that reviewers and examiners expect.
Reporting simple mediation (Model 4)
- Path coefficients a, b, and c′ with unstandardised (b) or standardised (β) estimates, standard errors, t-values, and p-values.
- The total effect c and the proportion mediated PM = ab/c (when c is non-zero).
- The indirect effect a × b with its standard error and the bootstrapped 95% CI, noting the number of bootstrap samples (e.g., 5,000 or 10,000) and whether the percentile or BCa method was used.
- R² for each regression equation.
The following example is illustrative and uses fabricated values for instructional purposes only. “Stress exposure (X) significantly predicted well-being (Y) through its effect on repetitive negative thinking (M): indirect effect b = −.14, SE = .04, 95% CI [−.23, −.06], based on 5,000 BCa bootstrap samples. The direct effect of stress on well-being, controlling for rumination, was b = −.08, SE = .05, p = .11, consistent with full mediation through this pathway.”
Reporting moderation (Model 1)
- Main effects of X and W with coefficients, SEs, and p-values.
- Interaction term X × W: b, SE, t, p, and the increment in R² (ΔR²) attributable to adding the interaction.
- Conditional slopes at specified values of W (mean ± 1 SD or Johnson–Neyman region), each with SE and significance test.
- A figure plotting Y against X at high, mean, and low W — strongly recommended by most journals and generally expected in dissertations.
Reporting moderated mediation
- All path coefficients from the constituent regression equations.
- Conditional indirect effects (a × b computed at specific values of W) with bootstrap CIs for each.
- The index of moderated mediation with its bootstrap CI — the single-number summary of whether moderation of the indirect effect is significant.
For a detailed walkthrough of the output structure that SPSS and R produce for regression-based analyses — and how each element maps to APA reporting requirements — the guide to running multiple regression in SPSS and reporting in APA provides the surrounding technical context for the constituent equations in any PROCESS model.
Common pitfalls and misconceptions
1. Treating cross-sectional mediation as proof of causality
Mediation analysis with cross-sectional data estimates a statistical indirect pathway — it does not prove that X causes M which causes Y. To strengthen causal interpretation you need experimental manipulation of X (and ideally M), longitudinal data where M is measured between X and Y temporally, or a design-based identification strategy such as instrumental variables. Frame indirect effects in cross-sectional work as “consistent with a mediation hypothesis” rather than as established mechanisms. For a broader overview of how research design choices shape what causal claims are permissible — across experimental, quasi-experimental, and observational designs — see the research methodology guide on Tesify.
2. Skipping centring before computing product terms
For moderation analysis, creating X × W without first mean-centring both variables inflates the correlation between main effects and the interaction term, producing apparent multicollinearity that complicates interpretation of b₁ and b₂. Centring does not change the interaction coefficient b₃ or its significance, but it makes the main effects interpretable as conditional effects at the mean of the other variable. PROCESS handles centring automatically; researchers writing their own syntax in R or SPSS should centre explicitly.
3. Interpreting the Sobel z-test as the definitive test of mediation
Many older papers report Sobel z and treat a non-significant result as evidence against mediation. Given the normality violation discussed above, this is not warranted. If you are reviewing literature that uses the Sobel test, do not conclude that mediation is absent based on those results alone. The relevant question is whether a bootstrap CI for the indirect effect would exclude zero — a test that older papers rarely report.
4. Using Baron & Kenny Step 1 as a gatekeeping filter
A non-significant bivariate X → Y correlation does not logically preclude mediation. Many dissertation writers abandon their planned mediation analysis when the total effect is non-significant. This is methodologically unwarranted. Test the indirect effect directly, regardless of the total effect’s significance.
5. Selecting mediators post hoc
Testing numerous candidate mediators without pre-specified theory inflates the familywise Type I error rate. Specify mediators and moderators a priori in your pre-registration or methods chapter. If you must test multiple parallel mediators, PROCESS supports this within a single Model 4 run; when comparing specific indirect effects against each other, apply confidence interval corrections for multiple comparisons.
6. Ignoring missing data before running PROCESS
PROCESS operates on complete cases by default. When data are not missing completely at random (MCAR), listwise deletion introduces bias into all path estimates by excluding a non-random subset of participants. Address missing data through multiple imputation or full-information maximum likelihood before passing the dataset to PROCESS. The guide to handling missing data in dissertations covers how to assess the missing data mechanism and choose an appropriate strategy in SPSS and R.
Software options in 2026
PROCESS macro for SPSS and SAS
PROCESS is freely downloadable from processmacro.org. In SPSS, install the .spd utility file and call the macro through Analyze → Regression → PROCESS v4.x. Specify the model number (4 for simple mediation, 1 for simple moderation), identify the X, Y, M, and W variables, set bootstrap samples to 5,000 or 10,000, and select the confidence interval type (percentile or BCa). The output is structured and self-labelled. The companion textbook — Hayes (2022), Introduction to Mediation, Moderation, and Conditional Process Analysis, 3rd edition, Guilford Press — provides worked examples for all 92+ model templates and is the methodological reference most examiners will cite.
R packages
Several R packages implement mediation and moderation with different theoretical emphases:
- processR: Implements Hayes’ PROCESS templates in R with near-identical syntax and output, including path diagram generation.
- mediation (Tingley, Yamamoto, Hirose, Keele, & Imai, 2014): Implements the potential-outcomes-based causal mediation analysis framework, accommodating non-linear models, generalised linear models, and binary mediators or outcomes.
- lavaan: When mediators or outcomes are latent constructs, specifying the full path model in lavaan combines SEM’s measurement-error correction with mediation estimation. Recommended reading: the companion article on structural equation modeling in 2026.
- interactions: Specialised for probing, plotting, and reporting interaction (moderation) effects from any model class — linear models, GLMs, mixed models — with Johnson–Neyman output and publication-quality figures.
JASP and Jamovi
Both JASP and Jamovi offer point-and-click mediation and moderation modules (via the SEMLj / medmod add-ons in Jamovi; the Mediation module in JASP) that produce bootstrap CIs without requiring the user to write syntax. They are suitable for students who want an intermediate step between SPSS and R. The full comparison across all four platforms for dissertation-level statistics — covering cost, reproducibility, APA output, and Bayesian capabilities — is available in the article on JASP vs Jamovi vs SPSS vs R for thesis statistics.
Whichever software you choose, run standard regression diagnostics on both equations within the PROCESS model before reporting results. Problems with multicollinearity, heteroscedasticity, non-linearity, or influential cases in the constituent regressions propagate directly into indirect effect estimates. The approach is identical to checking assumptions for any quantitative analysis: validate the analytic building blocks before interpreting the composite output.
FAQ
What is the difference between mediation and moderation in simple terms?
Mediation explains the mechanism through which X affects Y — a third variable M carries the effect along a causal chain. Moderation explains the conditions under which X affects Y — a third variable W strengthens or weakens the relationship. Mediation answers “how?” or “why?”; moderation answers “when?” or “for whom?” In a mediation model, M sits on the path between X and Y; in a moderation model, W sits outside that path and modifies its slope.
Do I still need to follow Baron and Kenny’s four steps in 2026?
The causal steps framework is no longer considered methodologically sufficient on its own. Contemporary practice tests the indirect effect directly using bootstrapped confidence intervals — as provided by Hayes’ PROCESS macro — and does not require the total effect (Step 1) to be significant as a prerequisite. You may still report individual path coefficients a, b, and c′ for descriptive completeness, but the inferential test of mediation rests on whether the bootstrap CI for a × b excludes zero, not on sequential significance checks across the four steps.
How many bootstrap samples should I use for mediation analysis?
Hayes recommends a minimum of 5,000 bootstrap samples; 10,000 provides more stable CI endpoints, particularly when using the BCa (bias-corrected and accelerated) variant. In your methods or results section, report the number of bootstrap samples used and whether you applied the percentile or BCa method. This information is necessary for readers to evaluate the precision of your indirect effect estimates.
What is the index of moderated mediation?
The index of moderated mediation (introduced by Hayes, 2015) is a single coefficient that quantifies how much the indirect effect (a × b) changes per one-unit increase in the moderator W. PROCESS reports this index alongside a bootstrap confidence interval. If that CI excludes zero, the indirect effect is significantly moderated — meaning the mediation pathway operates at a statistically different magnitude or direction across levels of W. This single index is preferable to simply comparing conditional indirect effects at two or three values of W, which does not constitute a formal test of moderation of the indirect effect.
Can I run mediation and moderation analysis with a cross-sectional dataset?
You can estimate mediation and moderation statistically with cross-sectional data, and many published studies do so. However, cross-sectional designs cannot establish the temporal ordering X → M → Y required for a causal interpretation of mediation. Acknowledge this explicitly as a limitation and frame indirect effects as “statistical pathways consistent with a mediation hypothesis” rather than as proven causal mechanisms. Moderation analysis is less sensitive to this concern because moderators condition a relationship without implying a temporal causal chain.
Which PROCESS model number should I use?
Use Model 4 for simple mediation (one mediator M, no moderator). Use Model 1 for simple moderation (one moderator W, no mediator). For moderated mediation where W moderates the a path (X → M), use Model 7. Where W moderates the b path (M → Y), use Model 14. For parallel multiple mediators (several Ms, same X), Model 4 still applies — list all mediator variables. For serial mediation (X → M₁ → M₂ → Y), use Model 6. Consult the model templates appendix in Hayes (2022) or the processmacro.org documentation for the complete taxonomy of over 92 templates.
Write your thesis with AI
Structure, draft, cite, and format your thesis faster with Tesify’s AI writing tools, automatic bibliography, and plagiarism checker. Free to start, no credit card required.






Leave a Reply