
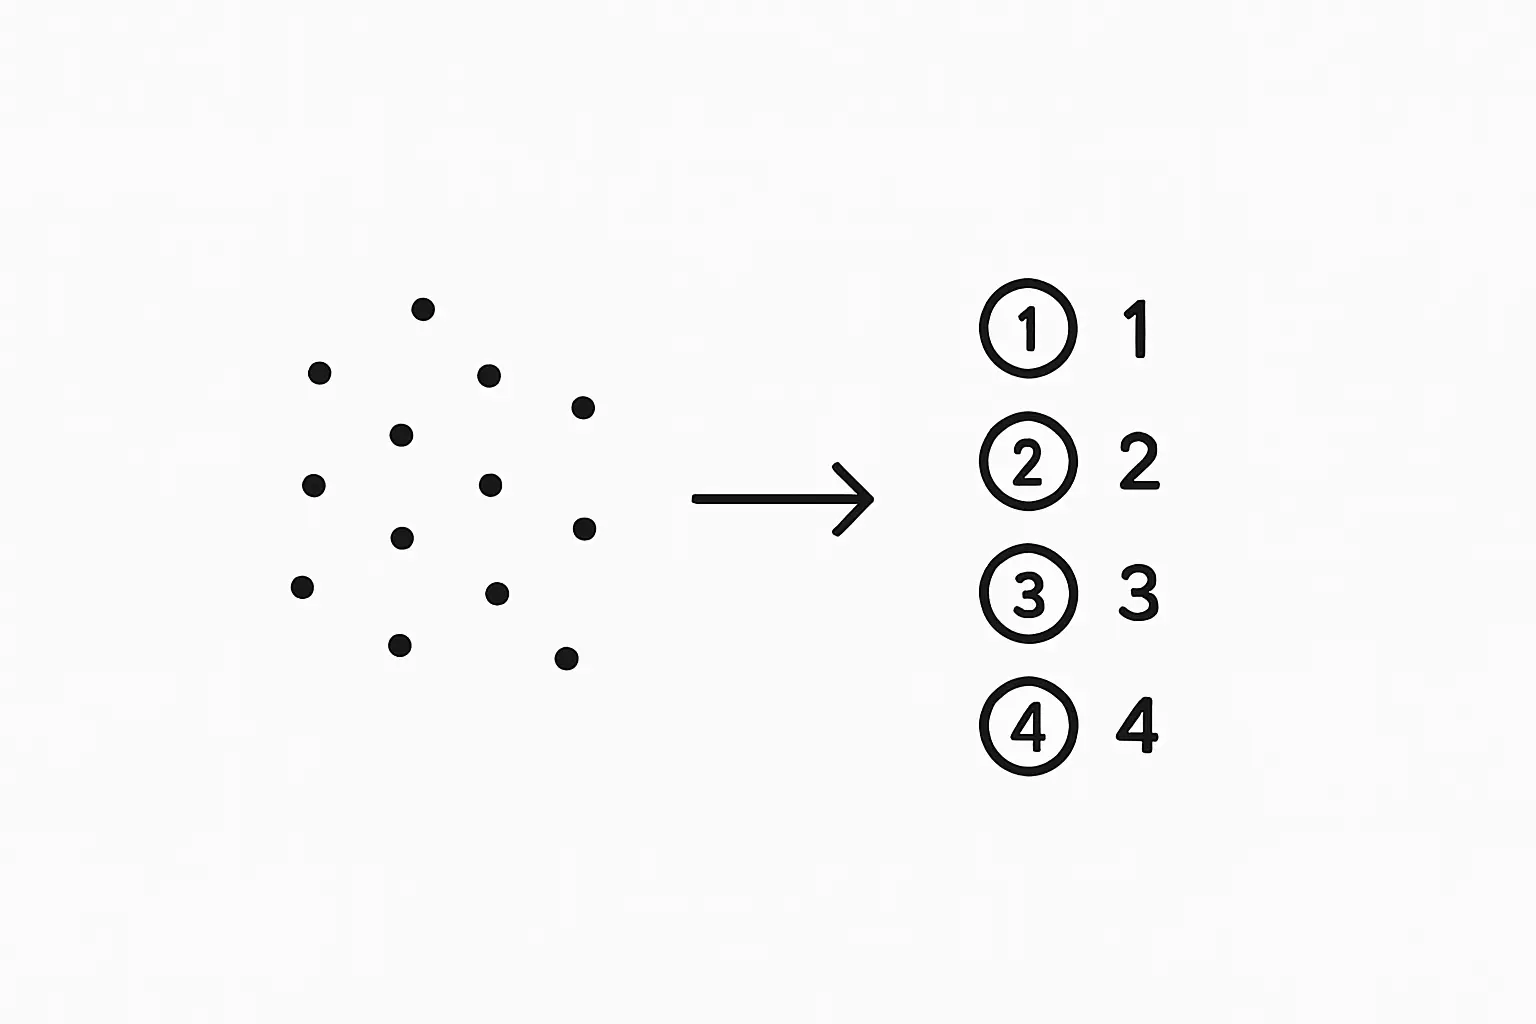
Non-parametric tests are inferential procedures that do not assume the data follow a specific distribution such as the normal. They work by ranking observations rather than using raw values, which makes them robust to outliers and appropriate for ordinal data — at the cost of some statistical power when parametric assumptions do hold.
When should you use a non-parametric test?
Four situations justify the choice, and only one of them is the one students usually cite.
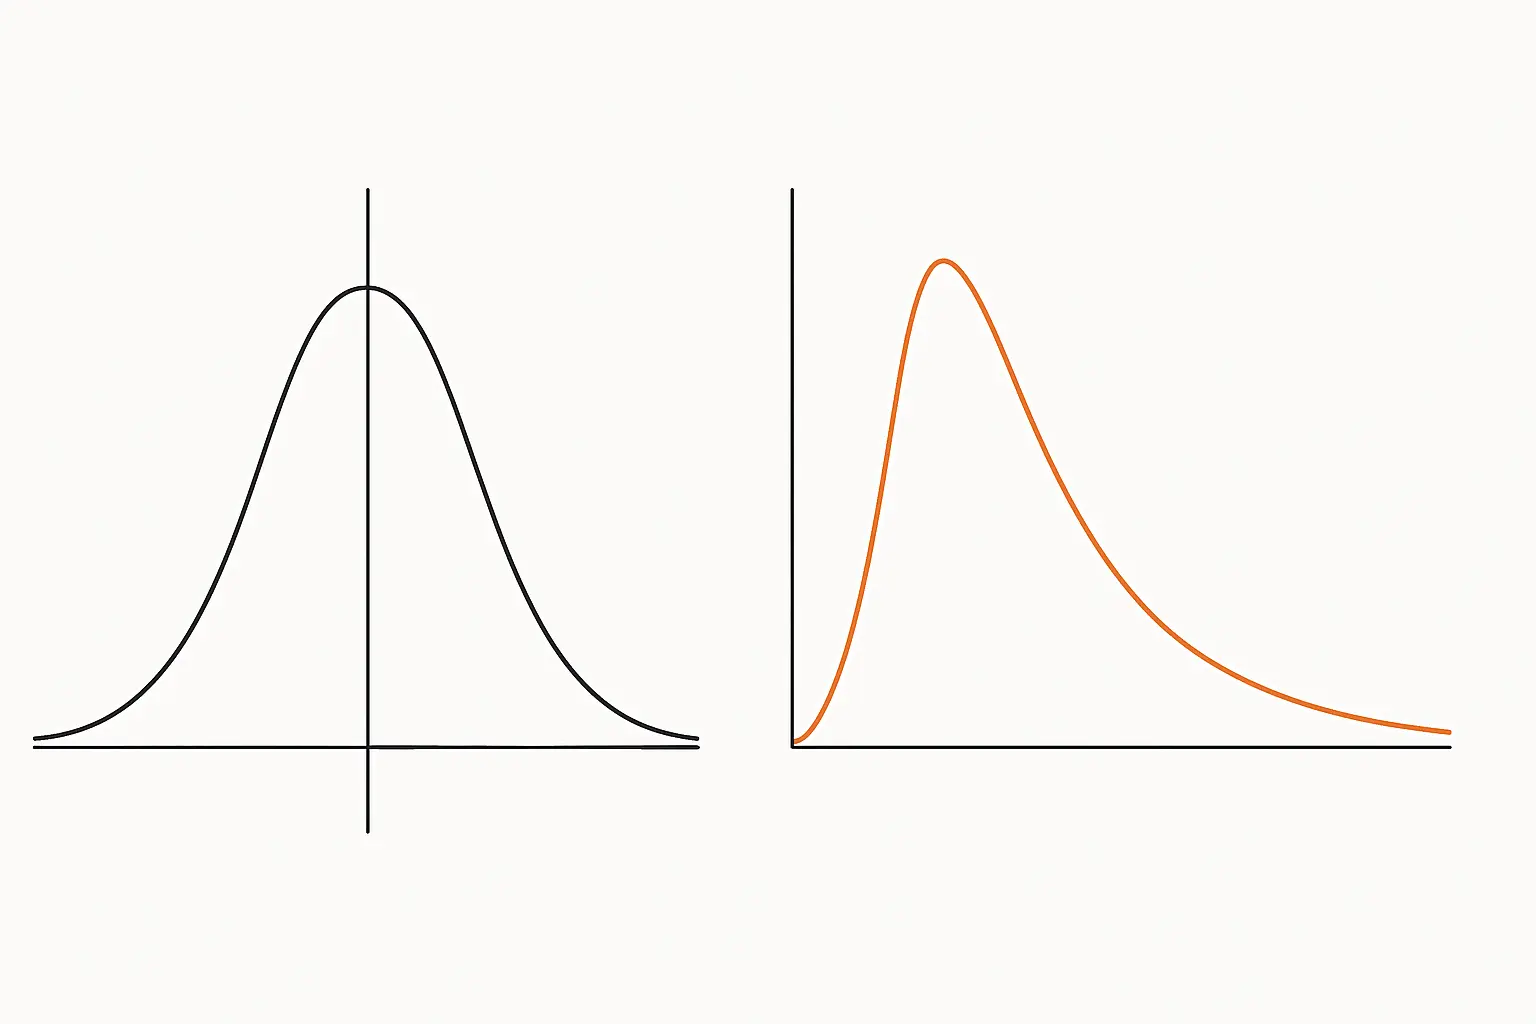
Use a non-parametric test when your dependent variable is genuinely ordinal, such as a single Likert item or a ranked preference. Use one when the sample is small and you cannot appeal to the central limit theorem to justify a parametric approach. Use one when the distribution is severely skewed or contains influential outliers that a transformation does not resolve. And use one when the assumption of homogeneity of variance fails badly in a way the parametric test cannot accommodate.
The situation students most often cite — “my data failed the Shapiro-Wilk test” — is the weakest justification of the four. Normality tests are highly sensitive in large samples, flagging trivial departures that have no practical effect on a t-test, which is itself robust to moderate non-normality. Inspect a histogram and a Q-Q plot before letting a significance test make the decision for you.
Which non-parametric test replaces which parametric one?
| Parametric test | Non-parametric equivalent | Design |
|---|---|---|
| Independent-samples t-test | Mann-Whitney U | Two independent groups |
| Paired-samples t-test | Wilcoxon signed-rank | Two related measures |
| One-way ANOVA | Kruskal-Wallis H | Three or more independent groups |
| Repeated-measures ANOVA | Friedman | Three or more related measures |
| Pearson correlation | Spearman’s rho or Kendall’s tau | Association between two variables |
| One-sample t-test | Sign test or one-sample Wilcoxon | Single sample against a value |
There is no clean non-parametric equivalent for factorial ANOVA. Where you have two factors and non-normal data, the usual routes are a transformation, an aligned rank transform procedure, or a generalised linear model with an appropriate distribution — not a series of separate Kruskal-Wallis tests, which discards the interaction you presumably care about.
What do these tests actually test?
This is the most widely misunderstood point in applied statistics, and it appears as an error in a large proportion of dissertations.
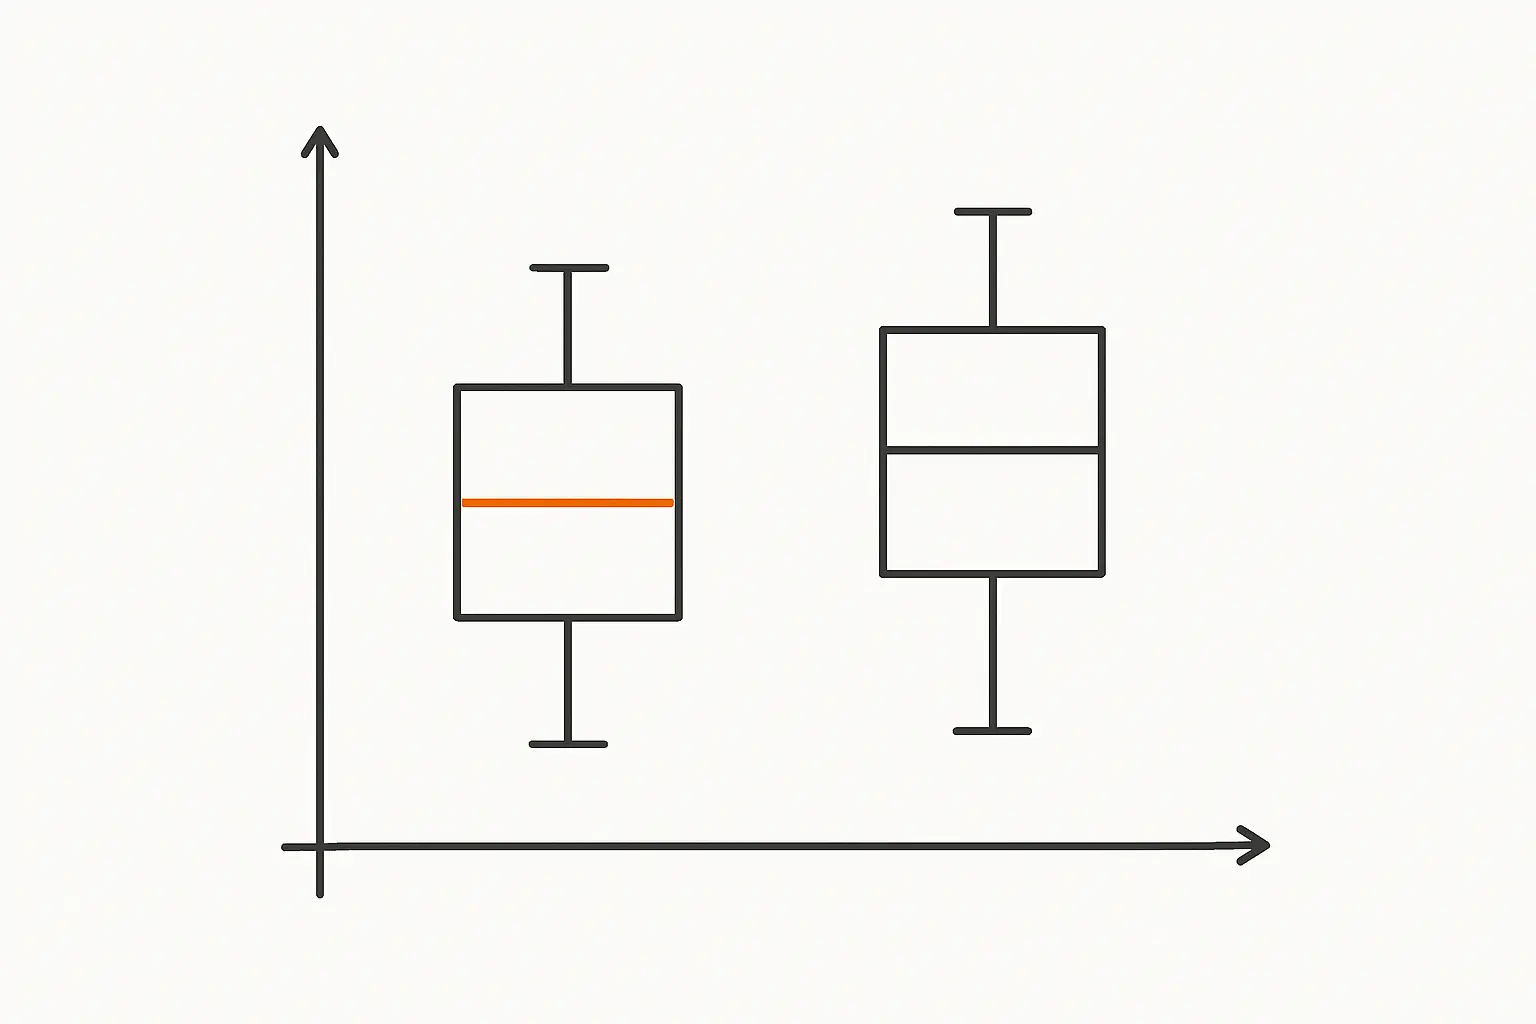
The Mann-Whitney U test does not test whether two medians differ. It tests whether one distribution is stochastically greater than the other — informally, whether a randomly chosen observation from group A tends to exceed a randomly chosen observation from group B. Only under the additional assumption that the two distributions have the same shape does it become a test of medians.
The practical consequence is that you should inspect the shape of both distributions before interpreting the result. If the shapes are similar, you may legitimately describe the finding in terms of medians. If they differ markedly, describe it in terms of distributions instead: “scores in group A were stochastically higher than in group B”. Kruskal-Wallis carries the same caveat across three or more groups.
Do non-parametric tests have assumptions?
Yes. “Non-parametric” means distribution-free with respect to a specified family, not assumption-free — a distinction that surprises many students.
All of these tests assume independence of observations, which no amount of ranking will rescue you from violating. Mann-Whitney assumes the dependent variable is at least ordinal and that the two groups are independent. Wilcoxon signed-rank assumes the distribution of difference scores is symmetric. Kruskal-Wallis assumes independence across groups and, for a median interpretation, similar distributional shapes. Spearman’s rho assumes a monotonic relationship, which is weaker than Pearson’s linearity assumption but is still an assumption.
Ties also matter. Heavy tying — common with short Likert scales — reduces power and requires the tie-corrected version of the statistic, which most software applies automatically but does not always report clearly. Our guide to designing Likert scale questionnaires covers the measurement side of this problem.
How much power do you lose?
Less than the folklore suggests. When parametric assumptions hold perfectly, the Mann-Whitney U test has an asymptotic relative efficiency of about 95% compared with the t-test — meaning you would need roughly 5% more participants to achieve equivalent power.
When assumptions do not hold, the relationship reverses and non-parametric tests can be substantially more powerful, particularly with heavy-tailed distributions where outliers inflate the parametric standard error. The blanket claim that non-parametric tests are “weaker” is therefore misleading: they are slightly less efficient under ideal conditions and often more efficient under realistic ones. Factor the efficiency difference into your sample size planning using our G*Power guide.
How do you report non-parametric results in APA format?
Report the test statistic, sample sizes or degrees of freedom, the exact p value, an effect size, and appropriate descriptive statistics — medians and interquartile ranges rather than means and standard deviations.
| Test | Reporting template | Effect size |
|---|---|---|
| Mann-Whitney U | U = 210.50, z = −2.34, p = .019, r = .29 | r = z / √N |
| Wilcoxon signed-rank | T = 45.00, z = −2.87, p = .004, r = .41 | r = z / √N |
| Kruskal-Wallis | H(2) = 11.32, p = .003, η²H = .18 | Epsilon-squared or eta-squared H |
| Friedman | χ²F(3) = 9.87, p = .020, W = .27 | Kendall’s W |
| Spearman | rs = .43, p < .001 | rs is itself the effect size |
A complete sentence reads: “A Mann-Whitney U test indicated that engagement scores were significantly higher for the intervention group (Mdn = 24, IQR = 6) than for the control group (Mdn = 19, IQR = 8), U = 210.50, z = −2.34, p = .019, r = .29.”
Note the leading zero is omitted from p and r, and that p = .000 in software output should be written as p < .001. Our guides to formatting APA tables and figures and effect sizes and confidence intervals cover the wider conventions.
What follow-up tests do you need?
A significant Kruskal-Wallis result tells you that at least one group differs, not which. Follow up with Dunn’s test with a multiple-comparison correction, which is designed for exactly this purpose and preserves the rank-based logic.
Do not follow up with a series of uncorrected Mann-Whitney tests — the family-wise error rate inflates quickly, and three pairwise comparisons at α = .05 gives roughly a 14% chance of at least one false positive. Similarly, a significant Friedman test is followed by pairwise Wilcoxon signed-rank tests with a Bonferroni or Holm correction.
Frequently asked questions
Do non-parametric tests require normally distributed data?
No — that is their defining advantage. They make no assumption about the underlying distribution family, though they do assume independence and, for some tests, similar distributional shape or symmetry of differences.
Is Mann-Whitney a test of medians?
Only under the assumption that both distributions have the same shape. Strictly, it tests stochastic dominance — whether values from one group tend to exceed values from the other. Check the shapes before describing your result in terms of medians.
Can you use non-parametric tests with Likert data?
Yes, and for single Likert items it is generally the appropriate choice, since a single item is ordinal. Composite scales made of many items are frequently treated as continuous, and parametric tests are widely accepted for them.
Are non-parametric tests less powerful?
Slightly, when parametric assumptions hold — the Mann-Whitney U test is about 95% as efficient as the t-test under ideal conditions. When assumptions are violated, non-parametric tests are often more powerful.
What do you report instead of means?
Medians and interquartile ranges, since rank-based tests are not about means. Reporting means alongside a Mann-Whitney result is a common inconsistency that examiners notice.
Is there a non-parametric two-way ANOVA?
Not a direct equivalent. Options include the aligned rank transform, a generalised linear model with an appropriate distribution, or robust ANOVA methods. Running separate Kruskal-Wallis tests discards the interaction and is not a substitute.
Should I test for normality before choosing?
Use normality tests as one input, not as an automatic decision rule. Shapiro-Wilk flags trivial departures in large samples and misses real ones in small samples. Inspect histograms and Q-Q plots, consider the robustness of the parametric test, and decide on the evidence as a whole.
Writing up the analysis
Choosing the right test is one problem; justifying that choice in prose an examiner accepts is another. Tesify helps you draft methodology and results chapters that explain and defend your analytical decisions, with citations formatted correctly throughout.
Write your thesis with AI
Structure, draft, cite, and format your thesis faster with Tesify’s AI writing tools, automatic bibliography, and plagiarism checker. Free to start, no credit card required.





Leave a Reply