

A chi-square test in SPSS examines whether two categorical variables are related (test of independence) or whether one categorical variable matches an expected distribution (goodness-of-fit). You run it through Analyze > Descriptive Statistics > Crosstabs, tick the Chi-square statistic, and report χ², degrees of freedom, sample size and p in APA format.
Which chi-square test do you actually need?
Students frequently run the wrong one. The choice depends entirely on how many categorical variables you are analysing, not on your sample size or your discipline.
Use the test of independence when you want to know whether membership of one category predicts membership of another — for example, whether degree level (undergraduate, master’s, doctoral) is associated with preferred referencing style. Use goodness-of-fit when you have a single variable and a theoretical expectation, such as testing whether respondents are evenly split across four campuses.
| Test | Variables | SPSS route | Typical research question |
|---|---|---|---|
| Goodness-of-fit | One categorical | Analyze > Nonparametric Tests > Legacy Dialogs > Chi-square | Are responses evenly distributed across categories? |
| Test of independence | Two categorical | Analyze > Descriptive Statistics > Crosstabs | Are the two variables associated? |
| Fisher’s exact test | Two categorical, 2×2, small cells | Crosstabs (reported automatically) | Same as independence, but expected counts are too small |
| McNemar test | Two categorical, paired | Crosstabs > Statistics > McNemar | Did the same people change category over time? |
How do you run a chi-square test of independence in SPSS?
The whole procedure takes under two minutes once your data are coded correctly. Each categorical variable must be stored as a single column of numeric codes with value labels attached — not as separate dummy columns.
- Set the measure level. In Variable View, set both variables to Nominal. SPSS will still run the test if you skip this, but the output tables are labelled incorrectly.
- Open Crosstabs. Go to Analyze > Descriptive Statistics > Crosstabs.
- Assign rows and columns. Convention places the independent (grouping) variable in Rows and the outcome in Columns. The chi-square value is identical either way, but percentages are easier to read this way.
- Request the statistic. Click Statistics, tick Chi-square, and also tick Phi and Cramer’s V for the effect size. Click Continue.
- Request the right cell contents. Click Cells and tick Observed, Expected, and under Percentages tick Row. The expected counts are what you need for the assumption check.
- Run and read. Click OK. The Chi-Square Tests table gives you the Pearson chi-square value, df, and asymptotic significance (2-sided).
What assumption must you check before trusting the result?
The chi-square approximation is only reliable when expected cell counts are large enough. The standard rule, attributed to Cochran, is that no expected count should fall below 1, and no more than 20% of cells should have an expected count below 5.

SPSS checks this for you. Directly under the Chi-Square Tests table you will see a footnote such as “0 cells (0.0%) have expected count less than 5.” If that percentage exceeds 20%, the Pearson chi-square is not trustworthy.
Your options are to collapse sparse categories into a sensible combined category, collect more data, or — for a 2×2 table — report Fisher’s exact test, which SPSS prints automatically in the same output block. Do not simply ignore the footnote; examiners who know the method look for it, and unreported assumption violations are a common source of corrections. If you are still designing your study, running an a priori calculation using our guide to sample size and power analysis with G*Power will usually prevent the problem entirely.
How do you report a chi-square result in APA 7th edition?
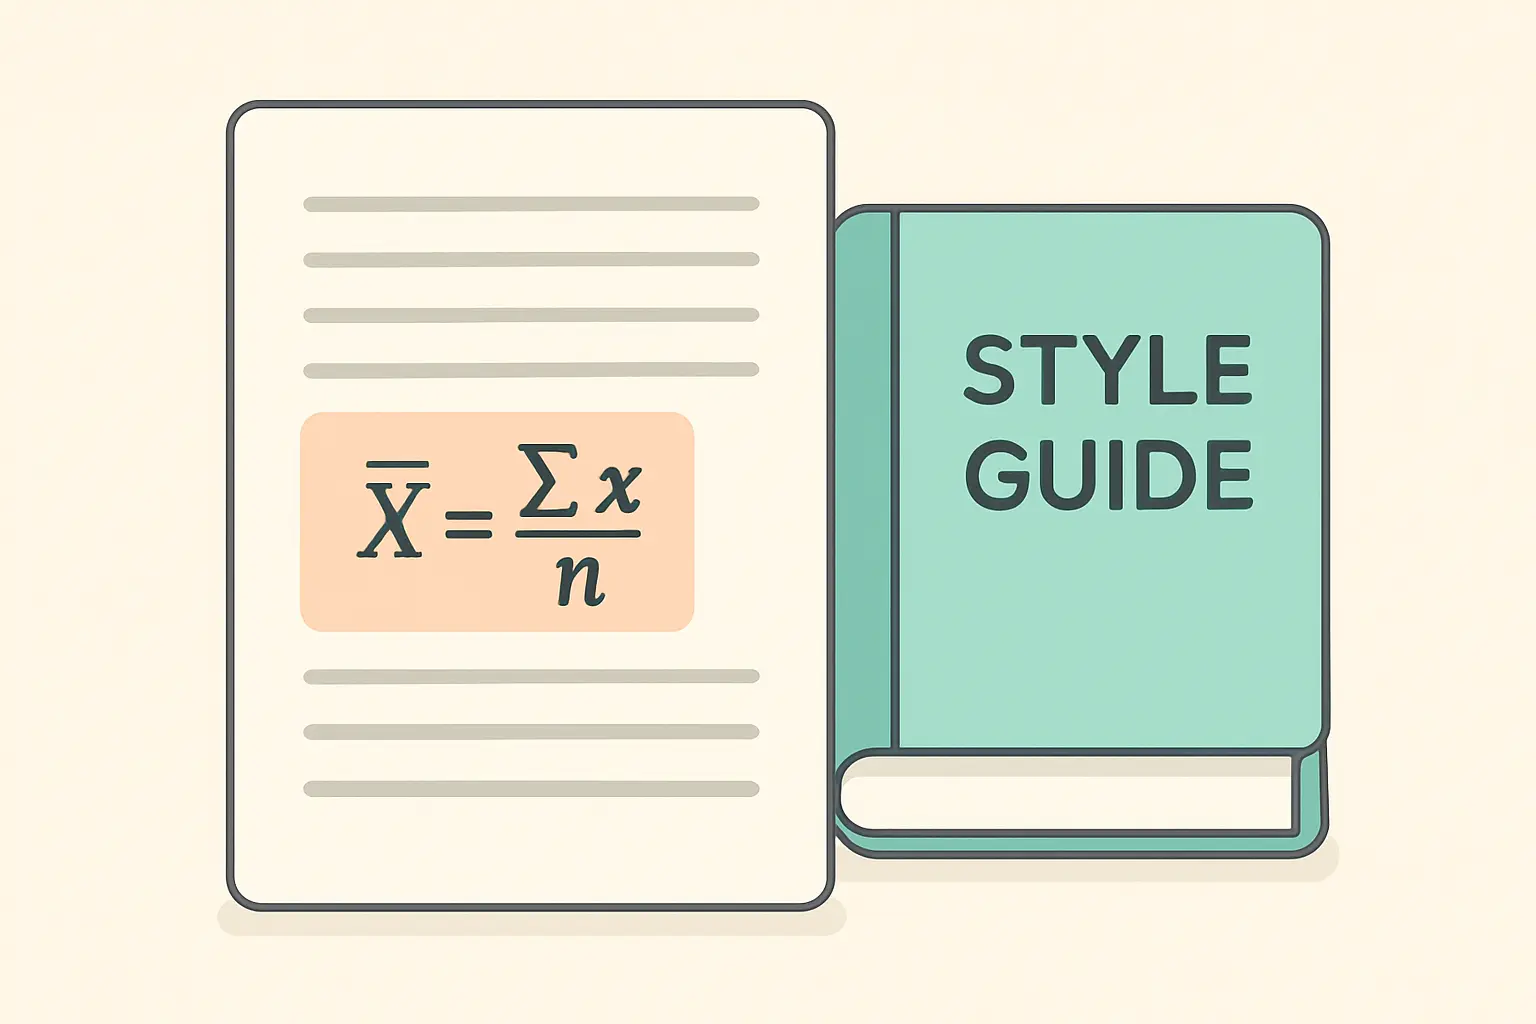
APA requires the symbol, degrees of freedom and sample size in parentheses, then the test statistic and the exact p value. The sample size goes inside the parentheses after the degrees of freedom, separated by a comma.
The template is:
χ²(df, N = total) = value, p = value, Cramér's V = value
A worked example reads: “A chi-square test of independence showed a significant association between degree level and preferred referencing style, χ²(4, N = 312) = 21.47, p < .001, Cramér’s V = .19.”
| Element | Correct | Common error |
|---|---|---|
| Chi-square symbol | χ² (italic Greek chi, superscript 2) | X2, x^2, “chi squared” |
| Leading zero on p | p = .03 | p = 0.03 |
| Very small p | p < .001 | p = .000 |
| Sample size | N italicised, inside parentheses | Omitted entirely |
| Decimal places | Two for χ², three for p | Six decimals copied from SPSS |
Note the SPSS output never shows p = .000. That figure means the value is smaller than .0005 and rounds to zero at three decimals; APA requires you to write p < .001 instead. When you paste the crosstabulation itself into your results chapter, follow the layout conventions in our walkthrough on formatting APA tables and figures.
Which effect size should accompany a chi-square?
A significant p value tells you an association probably exists; it says nothing about how strong it is. With samples of several hundred, trivially small associations become statistically significant, which is why APA expects an effect size alongside every test.
For a 2×2 table, report phi (φ). For any larger table, report Cramér’s V. Both range from 0 to 1. Conventional benchmarks treat roughly .10 as small, .30 as medium and .50 as large for a table with one degree of freedom, though these thresholds shift as the table grows, so interpret them alongside your discipline’s norms rather than mechanically.
How do you write the chi-square section of your results chapter?
Lead with the research question, present the descriptive pattern, then give the inferential test. Readers should understand what happened before they meet the statistics.
A well-structured paragraph moves through four moves: state what was tested, report the observed pattern with percentages, give the test statistic in APA form, then interpret the direction of the association in plain language. Keep the interpretation of meaning for the discussion chapter — the results chapter reports what the analysis found, as set out in our guide to writing a thesis results chapter.
If your dissertation also involves comparing means across groups, the reporting conventions differ, and our companion walkthrough on running an ANOVA in SPSS and reporting it in APA covers that case.
Frequently asked questions
Can you run a chi-square test on Likert scale data?
Only if you treat the scale as genuinely categorical, which usually wastes information. Likert responses are ordinal, so a Mann-Whitney U or Kruskal-Wallis test is generally more appropriate. If you do collapse a Likert scale into categories such as agree/neutral/disagree, justify the decision explicitly in your methodology. See our guidance on designing Likert scale questionnaires.
What does it mean if SPSS says 25% of cells have expected count less than 5?
It means the chi-square approximation is unreliable for your table. Collapse sparse categories, gather more responses, or use Fisher’s exact test if your table is 2×2. Report whichever remedy you chose and why.
Is the continuity correction row the one I should report?
For 2×2 tables SPSS prints a “Continuity Correction” row (Yates’s correction). Many methodologists now consider it overly conservative, and current practice in most fields is to report the Pearson chi-square, or Fisher’s exact test when expected counts are small. Follow your department’s convention and state which you used.
Do I need to report the crosstabulation table as well as the statistic?
Yes, in almost all cases. The crosstabulation shows the pattern; the statistic shows whether it is unlikely under the null hypothesis. Reporting only the statistic leaves examiners unable to see the direction of the association.
What is the difference between chi-square and a t-test?
A chi-square test compares frequencies across categories. A t-test compares means of a continuous variable across two groups. If your outcome is a count or a category, use chi-square; if it is a measured quantity, use a t-test or ANOVA.
Can I run a chi-square test in free software?
Yes. JASP, jamovi and R all run the same test at no cost and produce APA-ready output. Our comparison of JASP, jamovi, SPSS and R for thesis statistics sets out the trade-offs.
Turn your results into a finished chapter
Running the test is the quick part; writing it up in consistent academic prose across an entire results chapter is where most of the time goes. Tesify helps you draft, restructure and proofread your thesis chapters while keeping your citations formatted correctly, so your statistics and your writing arrive at the same standard.
Write your thesis with AI
Structure, draft, cite, and format your thesis faster with Tesify’s AI writing tools, automatic bibliography, and plagiarism checker. Free to start, no credit card required.





Leave a Reply