
Student Complaints and Academic Appeals Statistics 2026: What the OIA Data Shows
Almost every guide to challenging a university decision explains the procedure. Very few tell you what actually happens to the students who go through it. The Office of the Independent Adjudicator publishes that data every year, and the 2025 figures — the most recent full-year set — describe a system under visible strain and a set of odds that most students would want to know before they start.
Key findings: the OIA received 4,234 complaints in 2025, a 17 per cent rise on the previous year and the tenth consecutive annual increase. Academic appeals were the largest category at 42 per cent of complaints. One in five closed complaints (20 per cent) ended favourably for the student. And within academic appeals specifically, 68 per cent were decided Not Justified — the highest rate of any complaint category.
Scope: what this data does and does not cover
Read the boundaries before the numbers, because they are narrower than the phrase “student complaints” suggests.
The OIA is the designated ombudsman for higher education in England and Wales only. Students in Scotland go to the Scottish Public Services Ombudsman and students in Northern Ireland to the Northern Ireland Public Services Ombudsman, so no UK-wide figure exists in this series. In 2025, 96 per cent of complaints concerned English providers and 4 per cent Welsh ones. The scheme’s remit has also recently expanded to cover further education in Wales.
Second, the OIA only reviews a complaint once the provider’s own internal procedures are exhausted and a Completion of Procedures Letter has been issued. Everything below is therefore a picture of the small minority of disputes that survive the whole internal process — not of how often students complain to their universities.
Third, and most consequentially for anyone considering an appeal: the OIA cannot review academic judgment. It can consider whether a fair marking process was followed and whether feedback was consistent with the published mark scheme, but it cannot decide that a mark should have been higher. That single restriction explains most of the outcome data further down. For what the institutional grounds actually are, see the guides to who marks your dissertation and what happens if you fail it.
Complaint volumes: ten straight years of growth
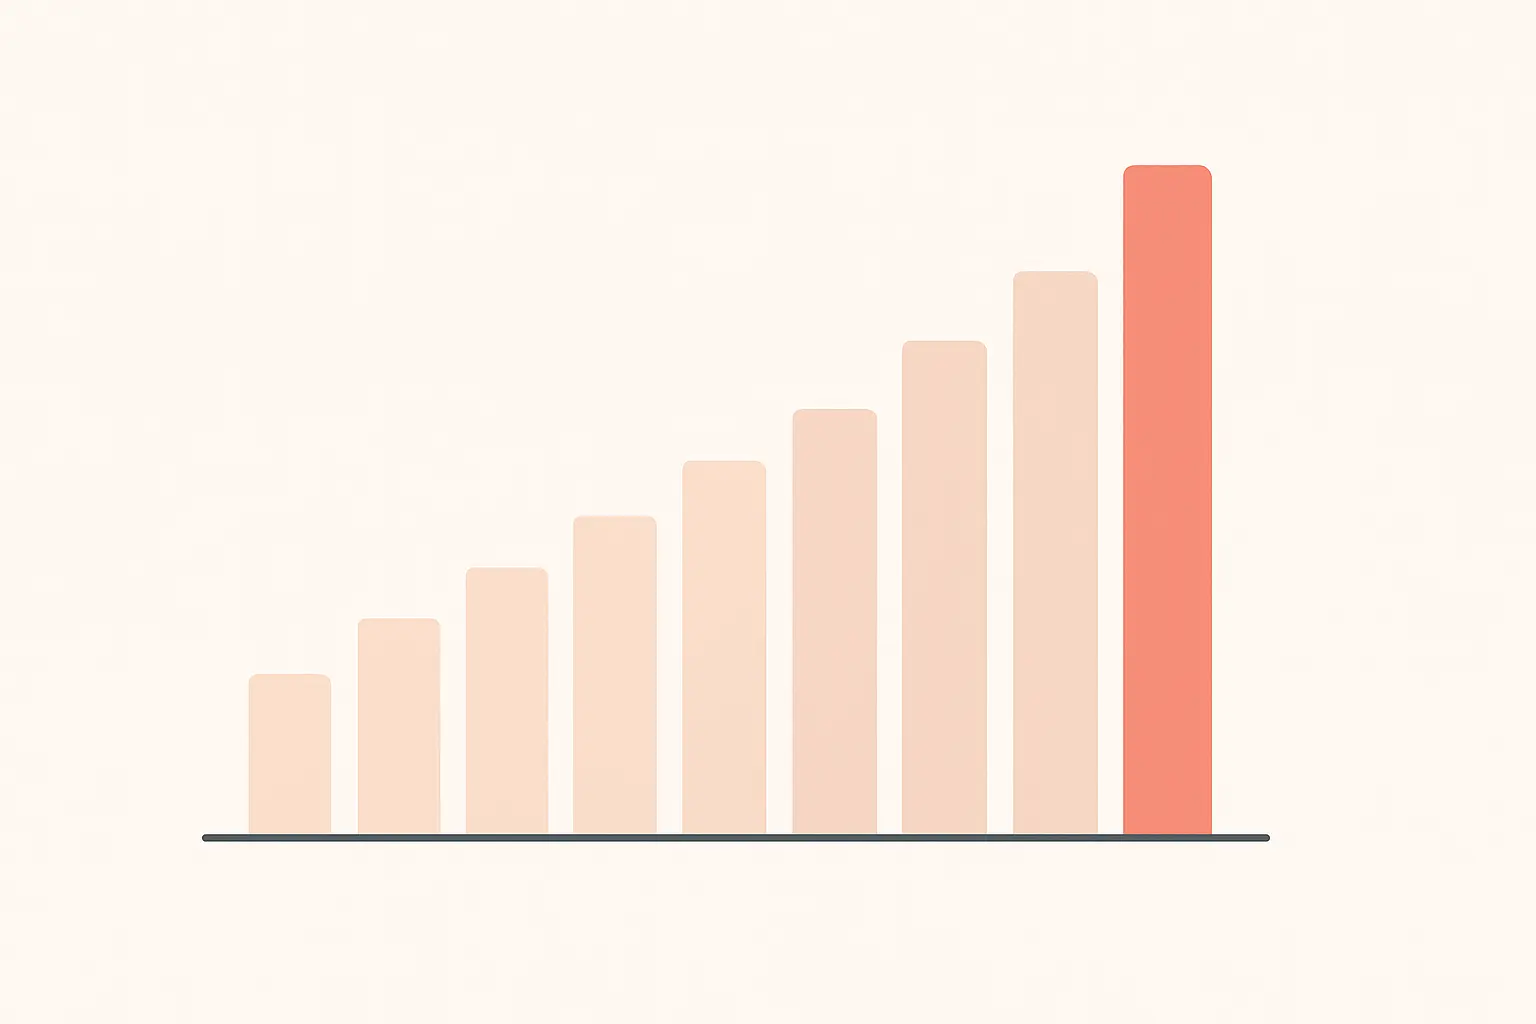
The OIA received 4,234 complaints in 2025, against 3,613 in 2024 — a 17 per cent increase. The full decade reads: 1,517 (2016), 1,635 (2017), 1,967 (2018), 2,371 (2019), 2,604 (2020), 2,763 (2021), 2,850 (2022), 3,137 (2023), 3,613 (2024), 4,234 (2025). Volumes have not fallen in any year of that series and have nearly tripled across it.
The 2025 rise was not evenly spread. The first half of the year saw only a small increase, followed by a sharp climb from July onwards, and October 2025 alone brought 516 complaints — the highest single month in the scheme’s history. The OIA reports finding no clear change in what students were complaining about to explain the surge.
One behavioural change did show up. In the second half of 2025, students brought complaints on average around three months after receiving their Completion of Procedures Letter, down from roughly four months at the start of the year.
What students complain about
| Category | Share of complaints received (2025) |
|---|---|
| Academic appeals | 42% |
| Service issues | 33% |
| Financial | 9% |
| Disciplinary matters (academic) | 5% |
| Welfare / non-course service issues | 4% |
| Disciplinary matters (non-academic) | 3% |
| Fitness to practise | 2% |
| Equality law / human rights | 1% |
| Other | 1% |
Academic appeals remain the largest category and cover individual assessment results, resit opportunities, progression decisions and degree classification calculations. The OIA notes that only a minority are direct challenges to academic judgment; the majority concern personal circumstances that students believe affected their performance and were not properly taken into account. That is the mitigating-circumstances route, and it is far and away the most common reason a student reaches the ombudsman.
Service issues rose from 30 per cent to 33 per cent, which the OIA links cautiously to sector financial pressure and consequent changes to staffing, teaching structures and course provision — while noting the data do not demonstrate that connection unequivocally.
Who complains
By level of study, 57 per cent of complaints came from undergraduates, 36 per cent from postgraduates, 6 per cent from PhD students and 1 per cent from others. By domicile, 61 per cent were home students and 33 per cent non-EU international students, with the OIA reporting international students as overrepresented, particularly in cases involving fees, refunds, deposits, attendance and visa issues.
42 per cent of students complaining to the OIA disclosed a disability, and complaints involving reasonable adjustments were markedly more likely to be upheld or settled than the caseload average.
By subject, the top ten were: business and management (736), subjects allied to medicine (524), social sciences (366), computing (356), law (349), engineering and technology (339), combined and general studies (244), design and creative and performing arts (242), psychology (181), and education and teaching (173). The distribution broadly tracks student numbers, with two exceptions the OIA highlights: law is the most overrepresented subject — possibly reflecting greater confidence in engaging formal processes — and biological and sport sciences the most underrepresented.
Outcomes: the numbers that matter most
| Outcome | Share of complaints closed (2025) |
|---|---|
| Not Justified | 43% |
| Not Eligible | 20% |
| Settled | 13% |
| Withdrawn | 9% |
| Not Justified (reasonable offer made) | 7% |
| Partly Justified | 5% |
| Justified | 2% |
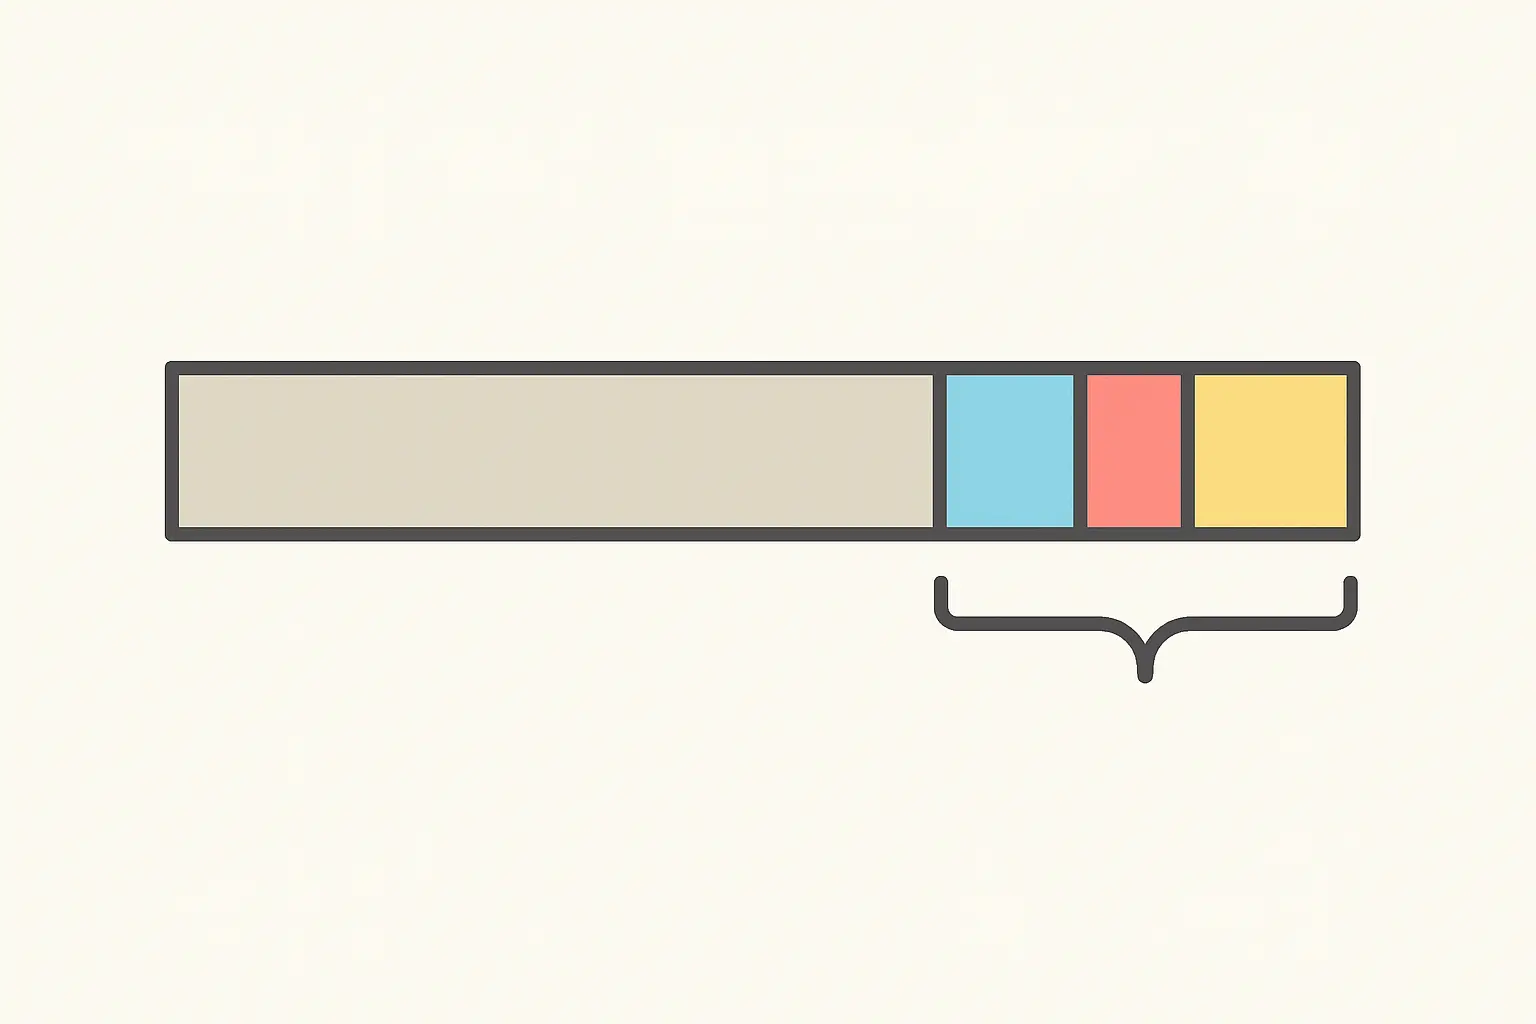
Combining Justified, Partly Justified and Settled gives the headline figure: 20 per cent of closed complaints ended favourably for the student. A further 7 per cent fell into “Not Justified (reasonable offer made)”, where the OIA judged the complaint had merit but the provider had already offered a fair remedy — in those cases financial offers ranged from £100 to £8,250, alongside non-financial remedies such as remarking work or reconsidering a student’s academic profile.
The category breakdown is where the picture sharpens. Not Justified decisions are most common in academic appeals, at 68 per cent, and in academic disciplinary cases at 61 per cent. The OIA’s explanation is straightforward: providers generally have well-established principles and processes that produce fair decisions in this area. The restriction on reviewing academic judgment does the rest of the work.
Settlements fell from 15 per cent in 2024 to 13 per cent in 2025, with 506 cases resolved that way, and the value of financial settlements also fell. Crucially, that decline was not matched by a rise in Justified or Partly Justified outcomes — the OIA reads this as providers being more financially cautious rather than as any decline in the quality of their internal decision-making.
The eligibility trap
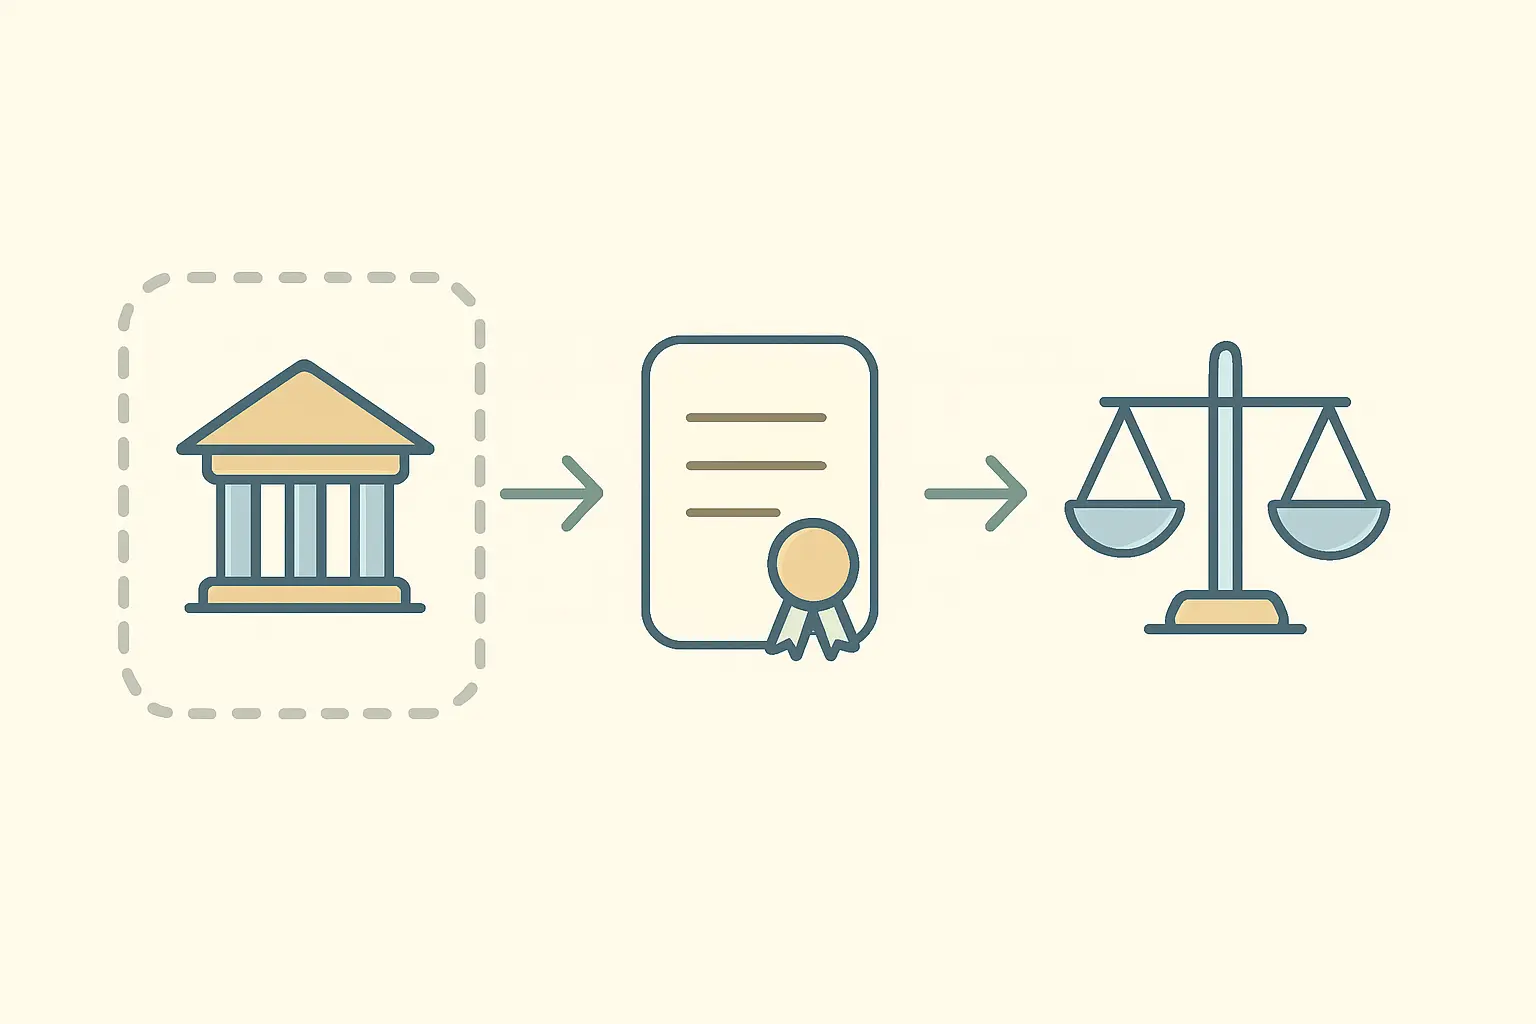
The most actionable statistic in the report is also the most avoidable. 20 per cent of complaints were Not Eligible for review, up from 16 per cent in 2024 — and 70 per cent of those were brought too early, before the provider’s internal procedures had finished.
That is roughly one complaint in seven failing on timing alone. The OIA notes that most premature complaints do not come from students who ignored the internal route, but from students who started it and felt they had waited too long for a decision. Not Eligible rates are now back at the levels last seen between 2020 and 2022, when providers were most affected by the pandemic.
The practical implication is unambiguous: wait for the Completion of Procedures Letter. Frustration at internal delay is understandable and is not a route in.
How long it takes
On the OIA’s side, more than 90 per cent of complaints were closed within six months in 2025, with average case handling time reduced to 81 days. That is the ombudsman stage only, and it sits on top of however many months the internal procedure took first — so a student planning around a decision should think in terms of the combined timeline, not the 81 days.
Group complaints remain rare: 17 in 2025, from just over 200 students in total, almost all concerning service issues.
What the data implies if you are considering an appeal
Four things follow from the figures, and none of them is “do not appeal”.
Complete the internal process first. One in five complaints fails on eligibility and most of those are simply premature.
Frame the complaint on process, not on the mark. The 68 per cent Not Justified rate in academic appeals is largely produced by students asking the ombudsman to do something it has no power to do. A regulation misapplied, or mitigating circumstances not considered, is reviewable; a disagreement about the quality of your work is not. The distinction is the same one set out in the guide to criterion-referenced versus norm-referenced assessment.
Submit mitigating circumstances at the time, not afterwards. Since most academic appeals turn on personal circumstances, the evidential position is set long before the appeal — a point that also governs the deadline scenarios covered in missing your thesis submission deadline.
Expect a remedy rather than a reversal. Where students succeed, the outcome is frequently a reconsideration, a remark, a further attempt or a modest financial payment. Very little of the caseload results in a grade being changed outright.
Using this data in your own work
The OIA’s annual report is a genuinely useful primary source for dissertations in education policy, higher education management and law, and it is freely downloadable. Cite the report and its year rather than a news summary of it, and state the England-and-Wales scope explicitly — the equivalent Scottish and Northern Irish figures come from different ombudsmen with different remits and are not comparable line by line. The guide to who publishes official statistics across the four nations covers how to navigate that.
Two cautions on interpretation. Rising complaint volumes are not by themselves evidence of falling quality: they also reflect a growing student population, greater awareness of the scheme, and increasing willingness to use it. And because the denominator is complaints that reached the ombudsman, none of these percentages describes the experience of the student body as a whole. For related institutional data, see degree classification statistics and extension and deferral statistics.
Source
All figures are taken from the Office of the Independent Adjudicator for Higher Education, Annual Report 2025, retrieved from oiahe.org.uk in August 2026. Percentages for complaints received and complaints closed are drawn from different bases and do not sum across the two tables.
If you are building an argument on this data — or on any official statistical release — Tesify can help you draft the passage with the scope conditions, the denominator and the source citation in place, which is where sourced statistics most often go wrong in a dissertation.
Write your thesis with AI
Structure, draft, cite, and format your thesis faster with Tesify’s AI writing tools, automatic bibliography, and plagiarism checker. Free to start, no credit card required.





Leave a Reply