
Degree Classification Statistics 2026: How Many Firsts Are Actually Awarded?
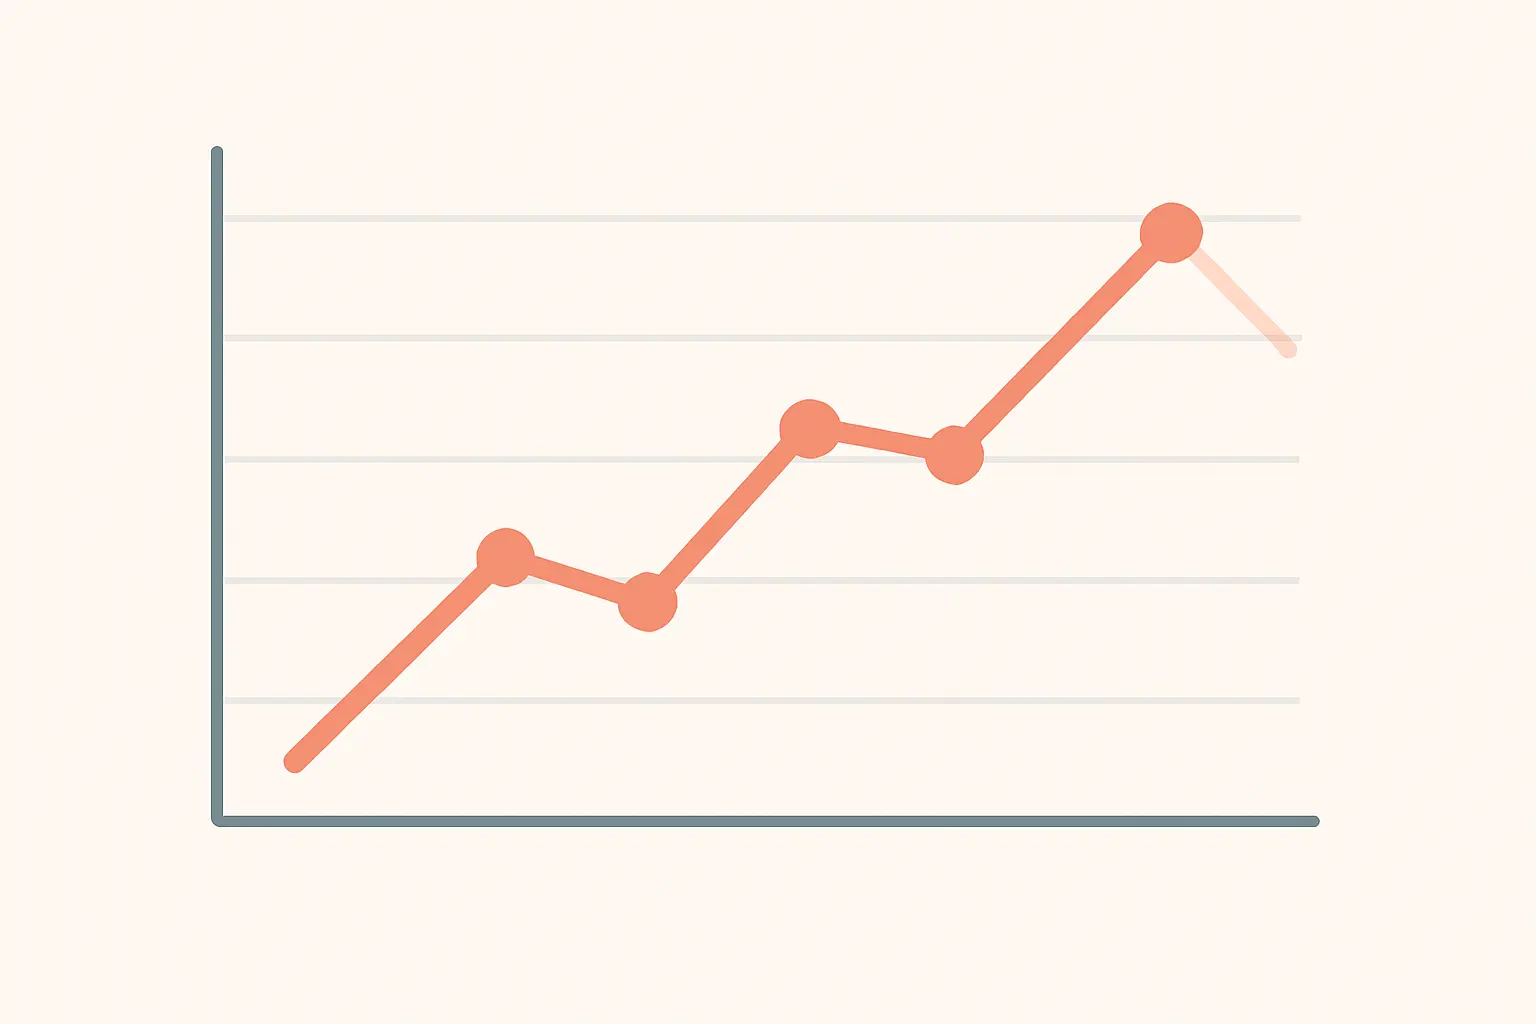
If you are working towards a target classification, it helps to know how many people actually reach it. The honest answer is that the distribution has moved a great deal in fifteen years, rose sharply during the pandemic, and has since fallen back two years running.
The figures below come from the Office for Students, which publishes an annual statistical analysis of degree classifications in England. Read the scope note before quoting any of them.
Key findings
- 29.6 per cent of graduates were awarded a first class degree in 2022-23 — down from a peak of 37.7 per cent in 2020-21.
- 77.6 per cent received a first or upper second combined, down 3.1 percentage points on the previous year and now slightly below the pre-pandemic 2018-19 figure of 79.0 per cent.
- Firsts have fallen for two successive years, by 4.4 points and then a further 3.7 points.
- Over the longer run the direction is still sharply upward: firsts stood at 15.8 per cent in 2010-11 and have not returned to anything near that level.
- The 2:2 has become markedly less common — 28.2 per cent in 2010-11, 19.3 per cent in 2022-23 — having dipped as low as 13.6 per cent at the pandemic peak.
- Of the 29.6 per cent awarded firsts, 13.4 percentage points were not statistically explained by changes in students’ entry qualifications or subject mix.
The full distribution

| Classification | 2010-11 | 2018-19 | 2020-21 | 2021-22 | 2022-23 |
|---|---|---|---|---|---|
| First | 15.8% | 29.4% | 37.7% | 33.3% | 29.6% |
| Upper second (2:1) | 51.7% | 49.6% | 46.8% | 47.5% | 48.0% |
| First and 2:1 combined | 67.5% | 79.0% | 84.5% | 80.7% | 77.6% |
| Lower second (2:2) | 28.2% | 18.2% | 13.6% | 16.8% | 19.3% |
| Third | 4.4% | 2.8% | 1.8% | 2.5% | 3.1% |
| Total graduates | 220,790 | 262,400 | 267,175 | 256,425 | 256,100 |
Source: Office for Students, Analysis of degree classifications over time: Changes in graduate attainment from 2010-11 to 2022-23 (OfS 2024.50), published 19 September 2024, Table 1. Numbers are rounded to the nearest five.
Scope — read this before citing the figures
These numbers are narrower than “UK degrees”, and citing them as though they were is the commonest error made with this dataset. The population is UK-domiciled undergraduates who were studying full-time when they started, registered at higher education providers in England, across the 143 English providers that awarded classified honours degrees to at least ten students in every year of the series. Scotland, Wales and Northern Ireland are not included, and neither are part-time starters or international students.
Note also that the denominator changed in this edition: graduates awarded a pass degree without honours are no longer identifiable in the data and have been removed from the base population across the whole time series. This lifts the reported proportion of firsts by roughly 0.3 percentage points a year relative to earlier OfS reports, so figures quoted from a 2023 publication will not match these exactly.
The shape of the trend
Three distinct phases are visible in the series, and conflating them produces bad arguments in both directions.
2010-11 to 2019-20: a steady climb. Firsts rose by roughly two percentage points a year. The OfS chose 2010-11 as its baseline precisely because increases before that year were much smaller.
2020-21: the pandemic peak. Firsts reached 37.7 per cent and the combined first-or-2:1 figure hit 84.5 per cent, as no-detriment policies and altered assessment took effect. The 2:2 fell to 13.6 per cent and thirds to 1.8 per cent.
2021-22 and 2022-23: two years of decline. Firsts fell 4.4 points and then 3.7 points, arriving at 29.6 per cent — statistically almost identical to the 29.4 per cent of 2018-19. The combined first-or-2:1 measure has gone slightly further, to 77.6 per cent, now below its pre-pandemic level.
So the pandemic bulge has essentially unwound. The long-run rise from 2010-11 has not.
Attainment by entry qualification
The sector average conceals a large spread by what students arrived with, and the pattern is not the obvious one.
Among 2022-23 graduates who entered with A-level grades of AAA or above, 47.9 per cent were awarded a first — an increase of 14.2 percentage points since 2010-11. But the largest increase over the period went to students entering with DDD at A-level, whose first-class rate rose 17.7 percentage points, from 6.7 per cent to 24.4 per cent. The smallest increase went to students entering with BTEC grades of DMM, from 6.9 per cent to 13.8 per cent.
Two things follow. Entry grades remain strongly associated with outcome — a student arriving with AAA is roughly three and a half times as likely to leave with a first as one arriving with DMM. But the gap has narrowed considerably, and the rise has not been concentrated among the highest-achieving entrants. The OfS also notes that since the pandemic, attainment for those entering with the highest A-level grades has returned to close to 2018-19 levels, while rates at the lower end of A-level grades and for other entry qualifications have stayed slightly above them.
How much your university matters
The OfS reports “large variation” in attainment across the 143 providers, in every year of the series. A sector figure of 29.6 per cent firsts is a mean across institutions whose individual rates sit well above and well below it.
It also flags a statistical caution worth carrying into any comparison you make: the biggest year-on-year swings occur at providers with small cohorts, where a handful of students changes the percentage substantially. A provider whose first-class rate jumped ten points in a year may simply be small.
How much of the increase is “unexplained”?
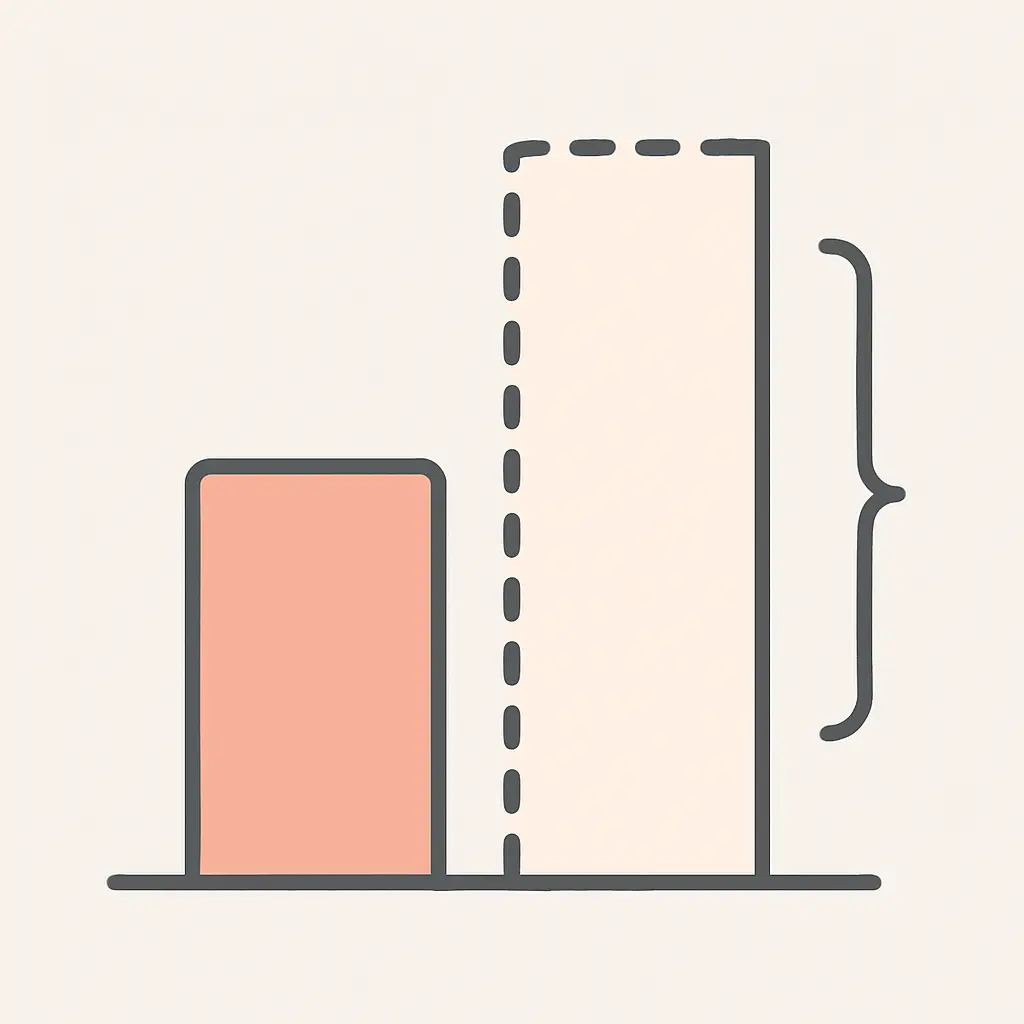
The OfS models what the classification distribution would look like if the only things that had changed since 2010-11 were the provider, subject of study, entry qualifications and age on entry of the graduating cohort. The gap between that prediction and reality is what it calls unexplained attainment.
For firsts, the model predicted 16.2 per cent in 2022-23 against a 2010-11 baseline of 15.8 per cent — an expected rise of just 0.4 percentage points. The observed figure was 29.6 per cent, a rise of 13.8 points, leaving 13.4 percentage points unexplained. For firsts and 2:1s combined the model predicted a small fall, to 66.6 per cent from 67.5 per cent, while the observed figure rose to 77.6 per cent — 11.0 percentage points unexplained.
The word is doing precise work and it is worth not overreading. The OfS is explicit that “unexplained” means its own variables cannot account for the change, not that the change is illegitimate. It acknowledges that genuine improvements in teaching quality could contribute, and notes that its model cannot capture pandemic assessment changes, teacher-assessed entry grades, or admissions routes based on audition or portfolio rather than A-levels and BTECs. So the figure measures what the model does not explain, not the amount of grade inflation.
What this means if you are writing now
Three things follow for a student working towards a classification.
A 2:1 is the modal outcome, not a safe one. Just under half of graduates get one, and roughly a fifth land in the 2:2 band. The gap between those two bands is often a handful of marks across a small number of modules.
The dissertation carries disproportionate weight. It is usually the single largest piece of credit in a final year, which makes it the most efficient place to move a borderline. Understanding how a dissertation is actually marked and where the rubric weights sit is worth more at this stage than any general study advice, and the analysis of what top-scoring theses have in common shows what the top band looks like in practice.
Your mark does not depend on your classmates. These are sector aggregates, not quotas. UK degrees are marked against published criteria rather than on a curve, so the fact that 29.6 per cent of graduates got a first does not mean your cohort has 29.6 per cent of firsts to allocate — see criterion-referenced versus norm-referenced assessment.
Where to get the underlying data
For England, the OfS report cited above is the analytical source, and its Annex A carries the provider-level distributions and the subject, entry-qualification and age breakdowns behind every chart.
For the whole UK, the Higher Education Statistics Agency publishes classified first degree qualifications by class in its annual student statistics release and maintains a longer published time series than the England-only analysis above. We were unable to retrieve HESA’s current tables directly while preparing this piece, so no figures from them are quoted here — go to the HESA site for the up-to-date UK-wide series rather than relying on second-hand numbers.
If you are citing any of this in your own work, cite the publication and its year rather than a news article reporting it, and state the population scope in your own sentence. Our guide to the UK grading system and GPA conversion explains how these bands map onto other systems.
Frequently asked questions
What percentage of students get a first?
29.6 per cent of UK-domiciled full-time graduates at English providers in 2022-23, down from a peak of 37.7 per cent in 2020-21 and up from 15.8 per cent in 2010-11.
What percentage get a 2:1 or better?
77.6 per cent in 2022-23. That is 3.1 percentage points down on the previous year and slightly below the pre-pandemic figure of 79.0 per cent in 2018-19.
Is grade inflation real?
The measurable part is the gap between modelled and observed attainment: 13.4 percentage points for firsts in 2022-23. Whether to call that inflation is a judgement the OfS deliberately does not make, since its model cannot capture teaching improvements or several changes in entry qualifications.
Are firsts becoming harder to get again?
The proportion has fallen two years running and is now close to where it was in 2018-19. Whether that continues is not something these figures can tell you.
Do these numbers cover Scotland, Wales and Northern Ireland?
No. The OfS regulates English providers, so this analysis covers England only. For UK-wide figures use the HESA series.
How many students graduate each year?
256,100 classified first degrees were awarded across the 143 English providers in this analysis in 2022-23 — broadly flat on the 256,425 of the previous year.
Does my entry grade determine my classification?
It is strongly associated with it but far from determining. Among 2022-23 graduates, 47.9 per cent of those entering with AAA or above got a first, against 24.4 per cent of those entering with DDD — a large gap, but one that has narrowed substantially since 2010-11.
Does my classification depend on my dissertation alone?
No, but it is usually the heaviest single component of the final year, and classification rules commonly weight the final year most. Check your programme regulations for the exact algorithm, because they vary.
Using these figures well
The most useful thing in this dataset is not the headline percentage — it is the scope note. A great many claims about “UK degree results” are made from England-only figures, and a marker who knows the source will notice. The second most useful thing is the entry-qualification breakdown, which shows how much the sector average hides.
If you are still writing the piece of work that will decide which band you land in, Tesify helps you get a draft into the shape the marking criteria describe, while there is still time for it to change the outcome.
Write your thesis with AI
Structure, draft, cite, and format your thesis faster with Tesify’s AI writing tools, automatic bibliography, and plagiarism checker. Free to start, no credit card required.






Leave a Reply