
Cluster Analysis in a Dissertation (2026): k-Means, Hierarchical Clustering and Latent Class Analysis
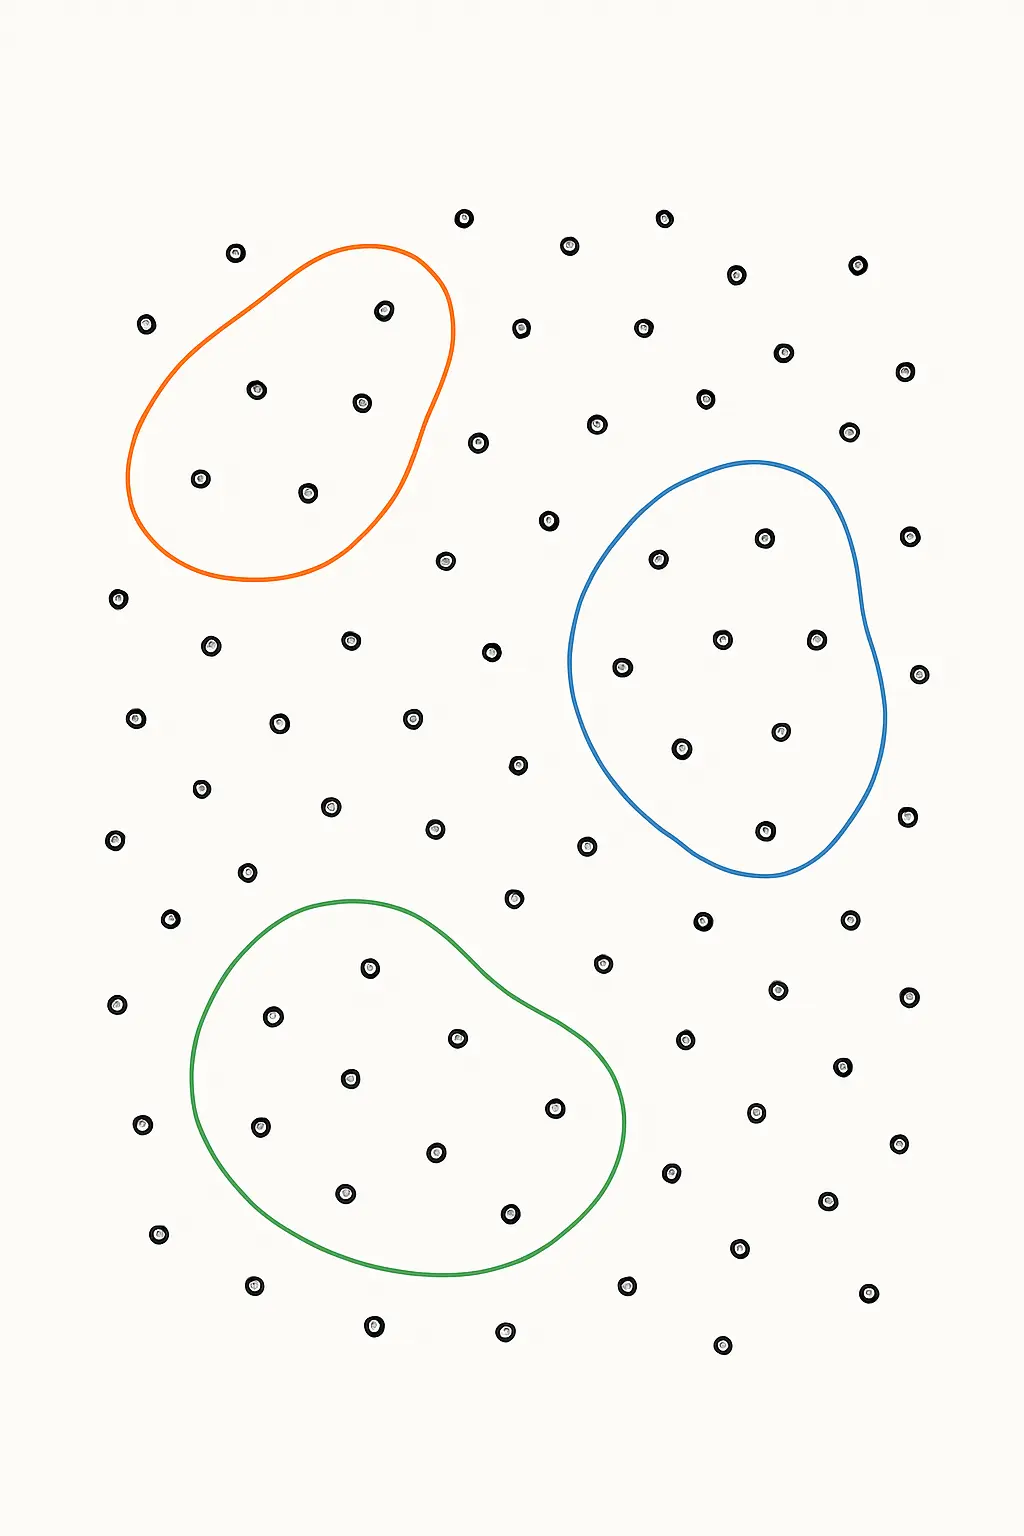
Most quantitative analysis starts with groups you already have — treatment and control, men and women, one course against another — and asks whether they differ. Cluster analysis inverts the question. It starts with no groups at all and asks whether your participants fall into distinguishable types on the basis of how they answered.
That inversion is what makes it useful and what makes it easy to misuse. There is no p-value that tells you a clustering is correct, no significance test that certifies the number of groups, and nothing in the output that will stop you from imposing structure on data that has none. The methodological work is entirely in the decisions you make and the way you defend them.
This piece sets out the three methods a dissertation is likely to need, the decisions each one forces, how to judge whether a solution is real, and what to report.
Clustering is not the same problem as nesting
One terminological hazard should be cleared first, because the same word names two opposite analytic situations and the confusion is common.
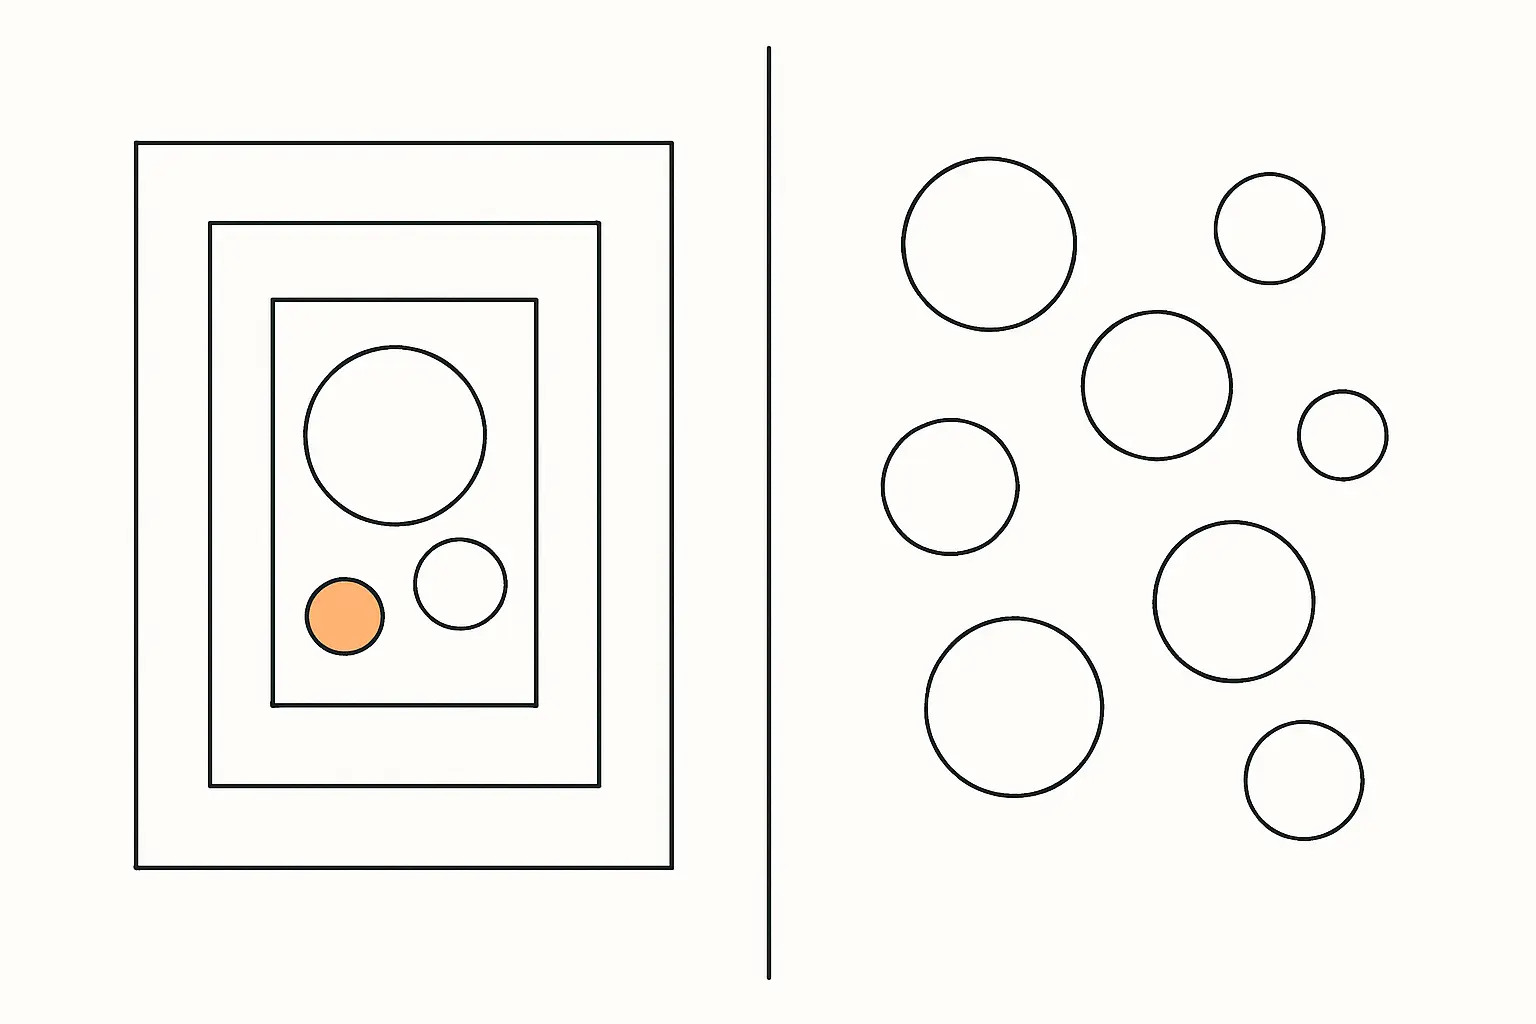
In multilevel modelling, “clustering” means that your units arrive already grouped — pupils inside schools, patients inside clinics — and the grouping is a known nuisance that distorts your standard errors. The structure is given and the problem is to account for it. That is the situation covered by the guide to multilevel models for nested data.
In cluster analysis, the grouping is unknown and discovering it is the entire point. The structure is the finding, not the nuisance. The two methods share a word and nothing else, and using the wrong one is a substantive error rather than a stylistic one.
Which method for which data
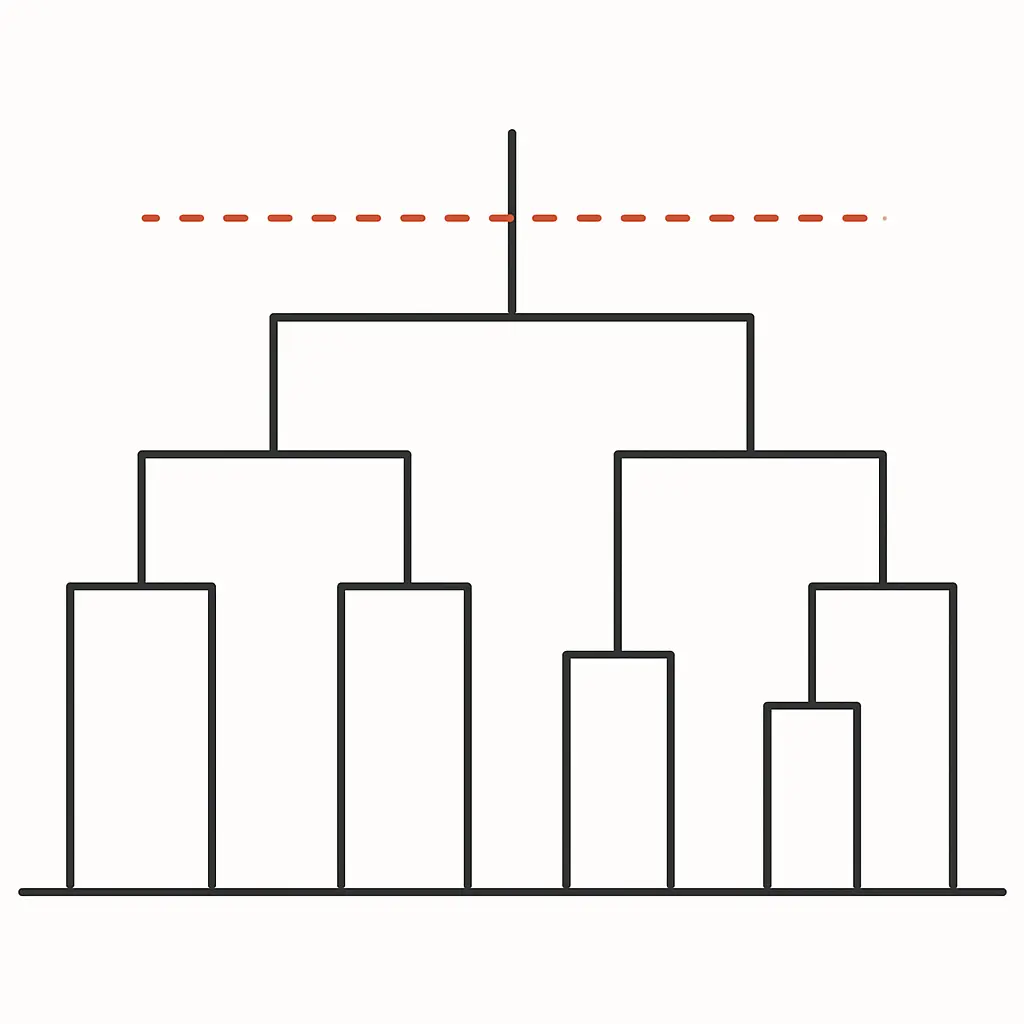
Hierarchical clustering builds a tree. It begins with every case as its own cluster and repeatedly merges the two most similar, producing a dendrogram you can cut at any height. You do not have to decide the number of clusters in advance, which is its great advantage for exploration. It becomes computationally awkward above a few hundred cases, and once two cases are merged they are never separated, so an early mistake propagates.
k-means partitions cases into a number of clusters you specify beforehand, iteratively moving cases between clusters until the within-cluster variation stops falling. It handles large datasets easily and produces clean, interpretable cluster centres. It requires continuous variables, assumes roughly spherical clusters of similar size, and is sensitive to its random starting points — run it repeatedly and confirm you get the same answer.
Latent class analysis is the model-based alternative and the right choice for categorical indicators. Rather than partitioning on distance, it estimates a statistical model in which an unobserved categorical variable explains the pattern of responses, and it assigns each case a probability of belonging to each class rather than a hard label. Because it is a model, it offers genuine fit statistics — the BIC in particular — to compare solutions with different numbers of classes. Its continuous-indicator equivalent is latent profile analysis.
The rough rule: categorical indicators point to latent class analysis, continuous indicators with a large sample point to k-means, and continuous indicators with a small sample or a genuinely exploratory question point to hierarchical clustering.
The decisions that determine your results
Which variables go in. This is the most consequential choice and the least often justified. Clustering will find groups using whatever you give it, so including three overlapping measures of the same construct effectively triples its weight. Select variables from theory, and check that they are not so highly correlated as to be redundant — the same logic that governs a factor analysis, and in fact factor analysis is a legitimate preliminary step to reduce a correlated battery to a smaller set of dimensions before clustering on those.
Standardisation. Distance-based methods are scale-dependent. If one variable runs 0–100 and another 1–5, the first will dominate the solution entirely. Convert to z-scores before clustering unless you have a specific reason not to, and state that you did.
Distance and linkage. Squared Euclidean distance is the default for continuous data. For linkage, Ward’s method tends to produce compact clusters of similar size and is the most common choice in the social sciences; single linkage tends to produce long straggling chains and is rarely what you want. Different linkage rules genuinely produce different trees from identical data, so name the one you used.
Outliers. Distance-based clustering is highly sensitive to extreme cases, which can pull a cluster centre away from the group it is meant to represent or form a spurious cluster of one. Screen first — the guide to handling outliers covers the decision — and if you are working with survey data, make sure invalid responses have already been removed, since straightliners cluster together beautifully and mean nothing.
Choosing the number of clusters
There is no test for this. There are several converging indications, and the defensible answer is the one that survives all of them.
The dendrogram gives you a visual answer: look for the height at which a large vertical distance separates one merge from the next, and cut below it. Large jumps indicate that the merge being made joins genuinely dissimilar groups.
The elbow method plots within-cluster variation against the number of clusters and looks for the point where the curve stops falling steeply. It is useful and frequently ambiguous.
The silhouette coefficient measures, for each case, how much closer it sits to its own cluster than to the nearest alternative. Values above about 0.5 suggest reasonable separation; values near zero mean the case sits on a boundary and could belong to either.
For latent class analysis you additionally have real model-comparison statistics. Fit models with increasing numbers of classes and compare the BIC, preferring the lowest, alongside entropy as a measure of how cleanly cases are classified. This is the strongest ground available for the decision, and it is one of the main reasons to prefer the model-based approach where your data allow it.
Above all, apply the interpretability test. A four-cluster solution you can describe substantively beats a five-cluster solution with marginally better statistics and one group you cannot characterise. Cluster analysis is judged on whether the types it produces are recognisable and useful, and that judgement is yours to make and defend.
Validating the solution
Because clustering will always return an answer, demonstrating that yours is not an artefact is the part that distinguishes a strong dissertation from a weak one.
Three checks are practical within a student project. Split-half replication: divide your sample at random, cluster each half separately, and see whether the same structure appears in both. Method agreement: run k-means and hierarchical clustering on the same data and cross-tabulate the assignments; substantial agreement is strong evidence, and disagreement is a warning. External validation: compare the clusters on a variable that was not used to create them. If your three consumer segments also differ in purchase behaviour you never entered into the model, the solution is telling you something about the world.
That last check is also the natural bridge to the rest of your analysis, since the cluster membership variable can then serve as a grouping factor in an ANOVA. One caution: differences on the clustering variables themselves are guaranteed by construction and are not a finding. Reporting that your clusters differ significantly on the variables used to build them is circular, and examiners notice.
Sample size and software
Cluster analysis has no formal power analysis, because there is no null hypothesis being tested. Practical conventions apply instead: aim for enough cases that your smallest expected cluster still holds a usable number, which in practice means at least 50 to 100 cases for a simple solution and considerably more for latent class analysis, where each additional class adds parameters. The general considerations in the sample size guide still shape what is realistic.
SPSS handles hierarchical clustering and k-means from Analyze > Classify and its two-step procedure will accept mixed variable types. Latent class analysis needs Mplus, Latent GOLD, or the poLCA or tidyLPA packages in R — see the roundup of free statistical software for students for the open options.
Reporting it
A cluster analysis section should let a reader reproduce your decisions. Name the method and justify it from your data type. List the clustering variables and say why those. State whether you standardised, and give the distance measure and linkage rule. Explain how you chose the number of clusters, citing more than one indicator. Report the size of each cluster. Profile them on the clustering variables and, separately, on external variables. Give the validation you performed. Then name your clusters descriptively.
Naming matters more than it appears. “Cluster 1, Cluster 2, Cluster 3” makes your discussion unreadable; “sceptical non-adopters”, “pragmatic majority” and “enthusiastic early users” make the finding usable. Derive the names from the profile, not from the story you wanted to tell.
Finally, be careful with the language of discovery. Clusters are a description of your sample, produced by your variable selection and your algorithm choices. They are not natural kinds waiting to be found, and a solution that replicates in your data may not replicate in anyone else’s. Write “three groups were identified in this sample” rather than “there are three types of student”.
Frequently asked questions
Is cluster analysis qualitative or quantitative?
Quantitative, though it is exploratory rather than confirmatory. It uses numerical distance or a statistical model to group cases, but the interpretation of what the groups mean is a judgement you make and justify.
What is the difference between cluster analysis and factor analysis?
Factor analysis groups variables that behave alike; cluster analysis groups cases that behave alike. They are transposes of one another, and a factor analysis is often a sensible first step to reduce a large item battery before clustering on the resulting dimensions.
How do I know whether my clusters are real?
You cannot prove it, but you can accumulate evidence: replication across split halves, agreement between two clustering methods, separation on the silhouette coefficient, differences on variables not used to build the solution, and substantive interpretability. Report all of them.
Can I use Likert items as clustering variables?
Composite scale scores are conventionally treated as continuous and work well with k-means. Single Likert items are ordinal, and latent class analysis handles them more honestly than a distance-based method does. See the guide to designing a Likert scale questionnaire.
Do I need to standardise my variables?
For any distance-based method, almost always yes, unless your variables are already on a common scale. Otherwise the variable with the widest numerical range silently dominates the solution.
What if two methods give me different clusters?
Report it. Disagreement usually indicates that the structure is weak rather than that one method is wrong, and saying so is more defensible than choosing the solution you preferred and omitting the other.
How do I handle missing data before clustering?
Most implementations delete a case with any missing value on the clustering variables, which can shrink your sample sharply. Address it deliberately using the options in the guide to handling missing data rather than letting the software decide silently.
Can I test whether my clusters differ significantly?
On external variables, yes, and that is a genuine finding. On the clustering variables themselves, the test is circular — they differ because you built the clusters to make them differ.
Is latent class analysis the same as latent profile analysis?
They are the same model with different indicators: latent class analysis for categorical indicators, latent profile analysis for continuous ones. Both belong to the mixture-modelling family and sit alongside the measurement models covered in the guide to structural equation modelling.
How many clustering variables should I use?
Few enough that every one is theoretically justified. Distance becomes less discriminating as dimensions multiply, so a focused set of five well-chosen variables usually outperforms twenty assorted ones.
Writing the chapter
The strongest cluster analysis chapters read as a sequence of defended decisions rather than a report of an output. Say what you clustered and why, how you chose the number of groups, what you did to test that the solution was not an artefact, and what the groups mean in the language of your field.
If you are drafting that chapter now, Tesify can turn your output and your decision notes into a methods and results passage with the justifications in the right places and the descriptive language appropriately hedged — which, in an exploratory analysis, is where most of the marks actually sit.
Write your thesis with AI
Structure, draft, cite, and format your thesis faster with Tesify’s AI writing tools, automatic bibliography, and plagiarism checker. Free to start, no credit card required.






Leave a Reply