
Multilevel Models for Nested Data: When Your Dissertation Sample Is Not Independent (2026)
Every ordinary regression, t-test and ANOVA rests on an assumption that is almost never checked in a student dissertation: that observations are independent of one another. It is the quietest assumption in the set, because nothing in the output warns you when it fails.
It fails whenever participants arrive in groups. Pupils recruited through six schools. Patients from four clinics. Employees within twelve teams. Survey respondents from eight branches of an organisation. In each case the data have a hierarchy, and the consequences for your standard errors are not small.
This piece sets out what clustering does to an analysis, how to measure whether it matters in your data, and what a multilevel model provides in exchange for the extra complexity.
What nested data is
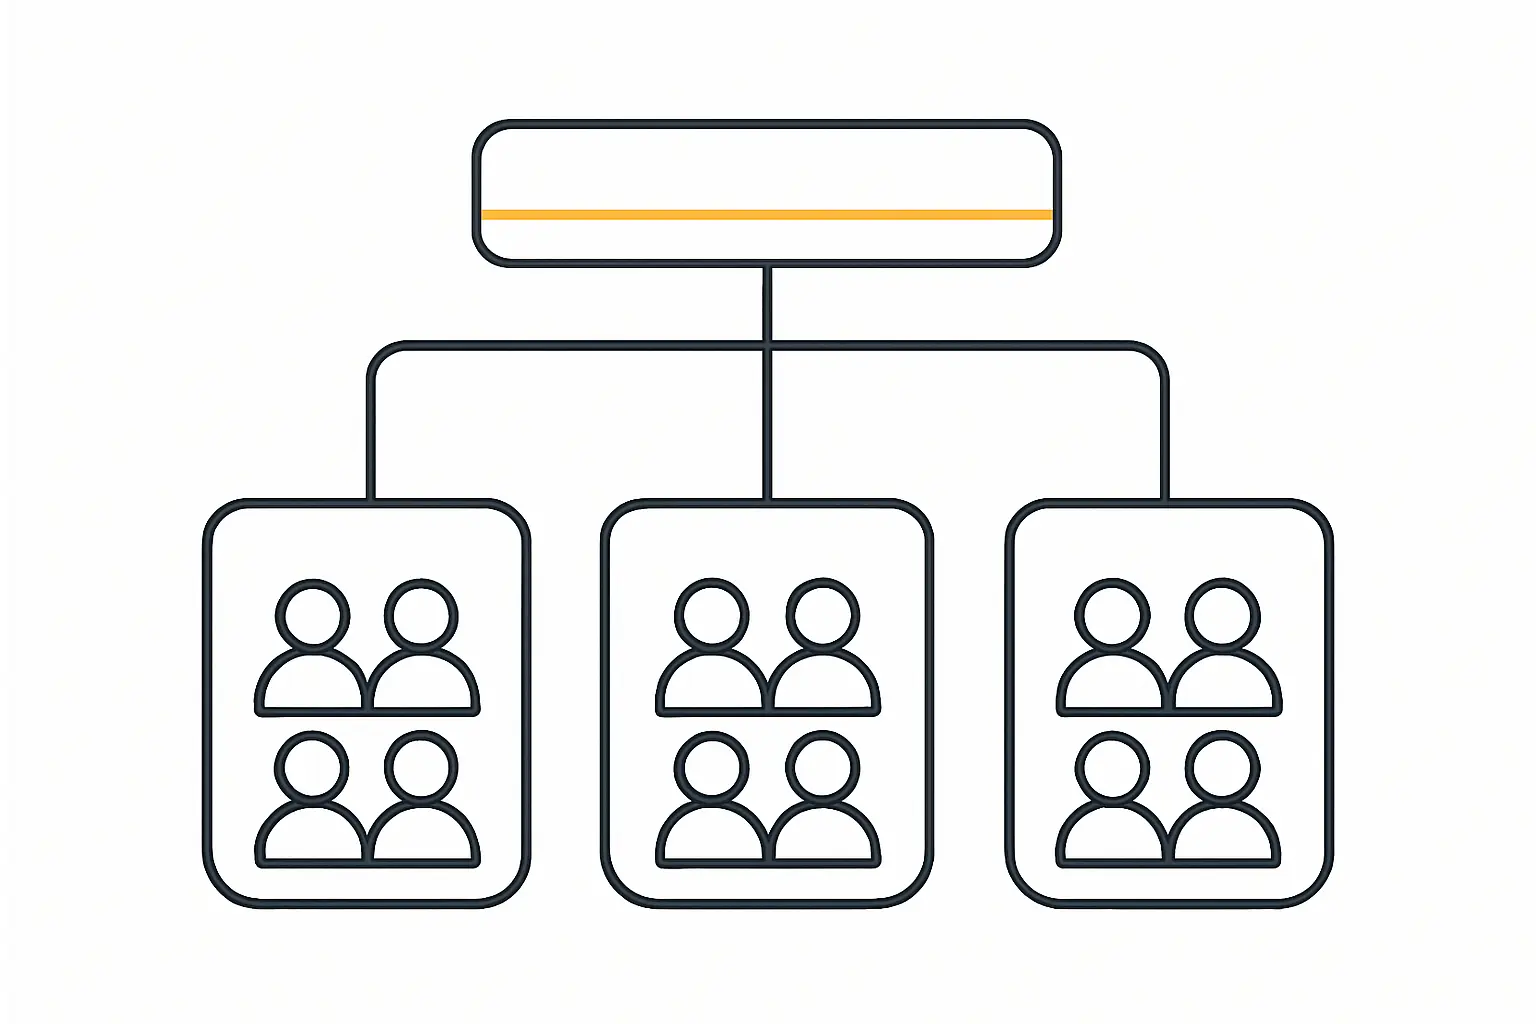
Data are nested when lower-level units belong to higher-level units. Pupils (level 1) sit inside classrooms or schools (level 2), which may themselves sit inside local authorities (level 3). The defining feature is that two pupils from the same school are, on average, more similar to one another than two pupils drawn at random from the population — they share a curriculum, a catchment, a teaching culture.
Repeated measures are the same structure wearing different clothes. When one participant is measured on six occasions, those six observations are nested within the person, and the person is the level-2 unit. Growth curve models are multilevel models with time at level 1.
A note on vocabulary, since the literature is unusually fragmented here. Multilevel model, hierarchical linear model, mixed-effects model, random-effects model and variance components model largely refer to the same framework, and which term you meet depends on whether you are reading education, psychology, biostatistics or econometrics. Searching only one of them on Google Scholar will hide most of the relevant literature.
Why ignoring the hierarchy is not a small error
When observations within a cluster resemble each other, each additional participant from an already-sampled cluster contributes less new information than a genuinely independent participant would. Ordinary regression does not know this. It counts all 300 pupils as 300 independent pieces of evidence.
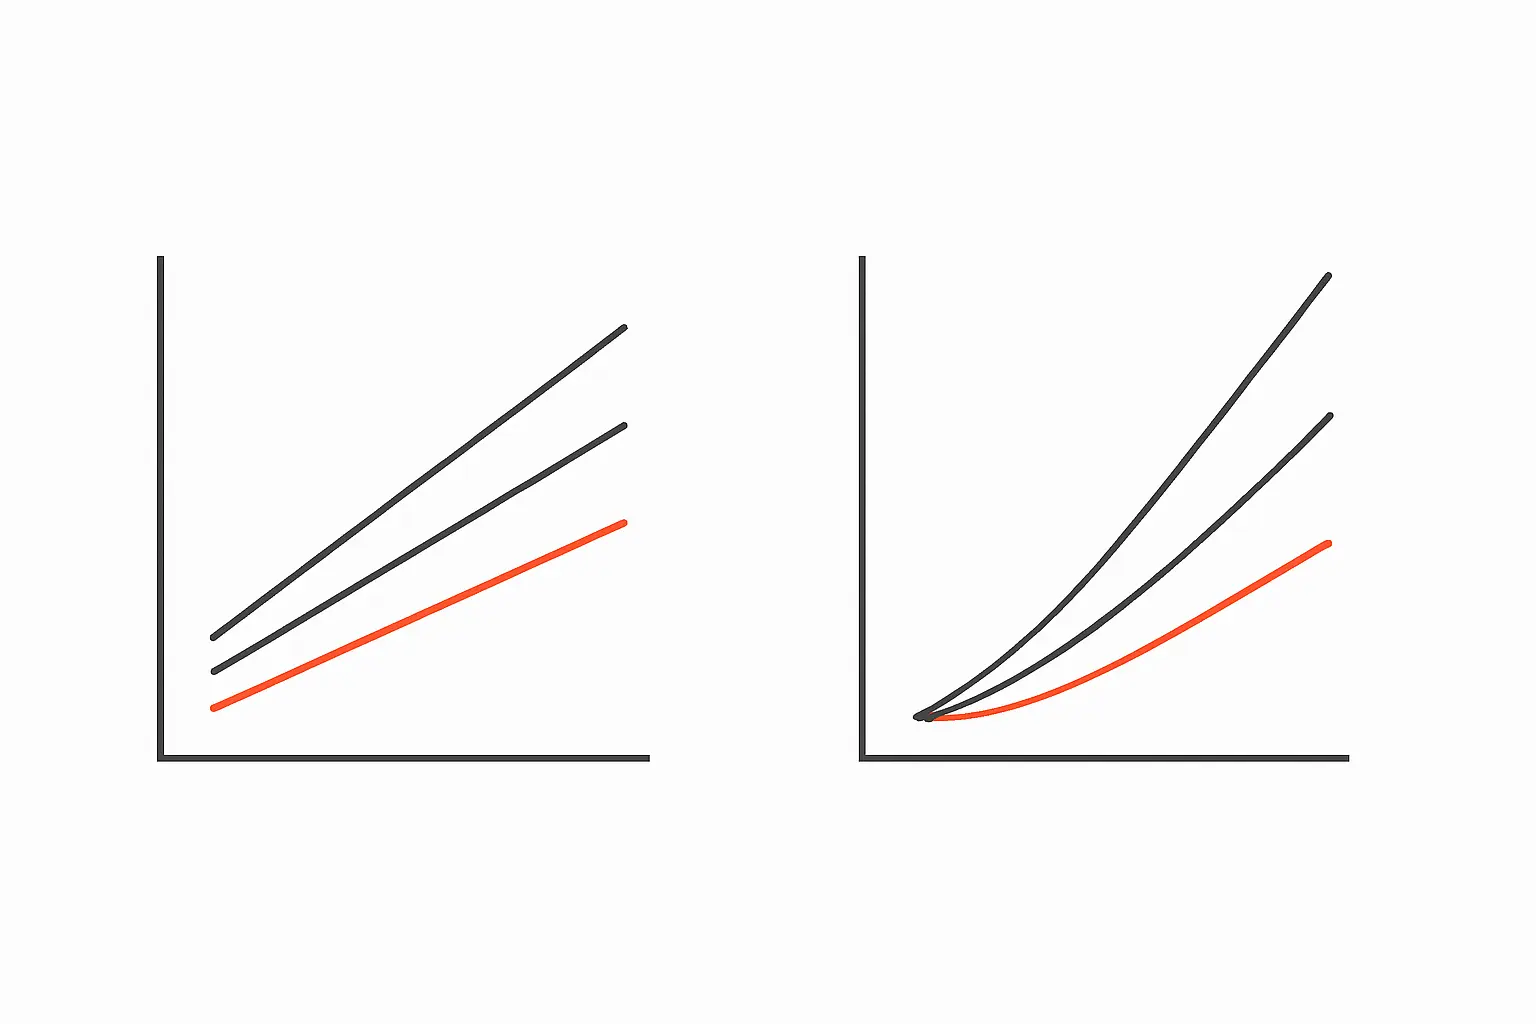
The result is standard errors that are too small, confidence intervals that are too narrow, and p-values that are too low. The inflation runs in one direction: towards finding effects that are not there. This is not a marginal distortion to be noted in a limitations paragraph — it can invert the conclusion of a study.
Two quantities make the size of the problem concrete.
The intraclass correlation
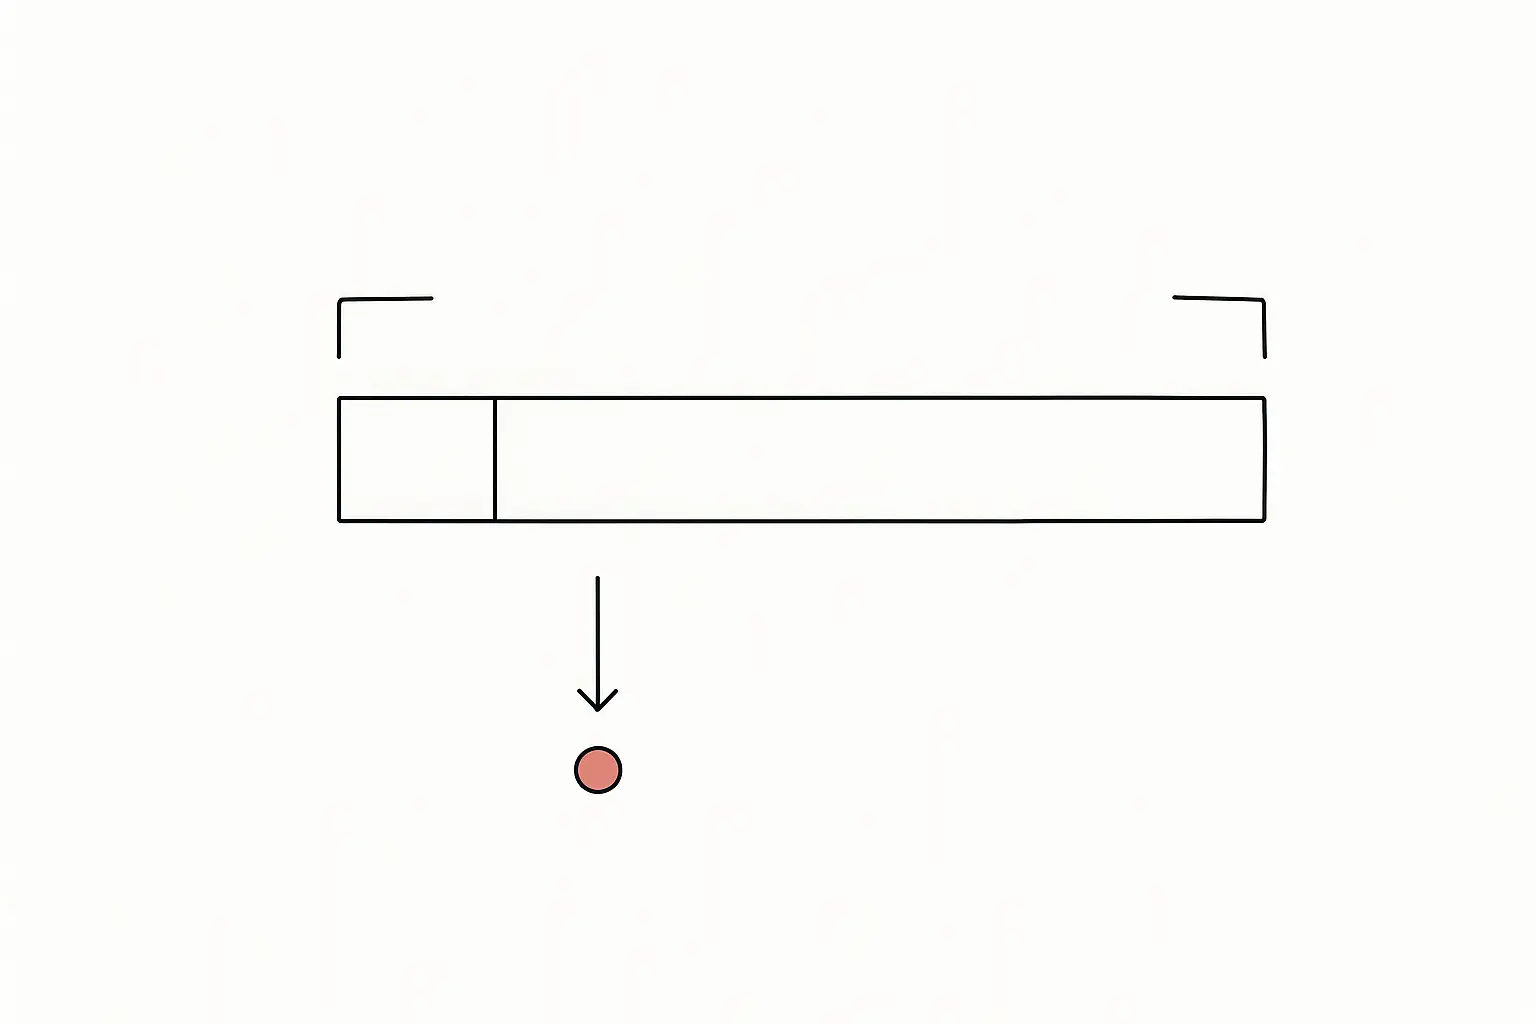
The intraclass correlation coefficient is the proportion of the total variance in your outcome that lies between clusters rather than within them. An ICC of 0 means cluster membership tells you nothing. An ICC of 0.15 means 15 per cent of the variation in your outcome is attributable to which cluster a participant belongs to.
You obtain it by fitting an empty or null model — a multilevel model containing the cluster structure and no predictors at all. That model does one job: it partitions the variance and hands you the ICC. It is the first model anyone fits, and it is what tells you whether the rest of this article applies to your data.
Be careful with the acronym. The intraclass correlation used in reliability work — quantifying agreement between raters — is computed differently and answers a different question, despite sharing a name and an abbreviation. If you are looking for that one, see the guide to inter-rater reliability and the ICC.
The design effect
The ICC on its own is easy to dismiss as small. The design effect is what makes it concrete, because it accounts for how many people sit in each cluster:
Design effect = 1 + (average cluster size − 1) × ICC
Suppose you have 300 pupils across 10 schools, 30 per school, and an ICC of just 0.05 — a value most people would wave away. The design effect is 1 + (29 × 0.05) = 2.45. Your effective sample size is 300 ÷ 2.45, roughly 122. You planned for 300 participants’ worth of statistical power and you have the equivalent of 122.
This is the number to put in front of a supervisor who says the clustering is probably negligible. Small ICCs with large clusters are not negligible; the cluster size does the damage.
What a multilevel model gives you
A multilevel model estimates variation at each level of the hierarchy simultaneously, rather than pretending one of them does not exist. It delivers three things an ordinary regression cannot.
Correct standard errors. The model knows how much independent information it actually has, so the inference is honest.
Random intercepts. Each cluster is allowed its own baseline level of the outcome. Some schools simply start higher than others, and the model absorbs that instead of attributing it to your predictors.
Random slopes. The effect of a predictor can itself vary by cluster. If additional study time raises attainment more in some schools than others, a random slope estimates that variability rather than averaging it away — and the variability is frequently the more interesting finding.
The framework also lets you ask questions that are unavailable otherwise. A cross-level interaction tests whether a cluster-level variable moderates an individual-level relationship — for example, whether the effect of a pupil’s motivation on attainment depends on the school’s class size. That is a genuinely two-level question and it cannot be posed in a single-level model.
Two decisions that change your results
Centering. How you centre level-1 predictors is a substantive choice, not a technical detail. Group-mean centering expresses each participant relative to their own cluster’s average and isolates the within-cluster effect. Grand-mean centering expresses them relative to the overall average and blends within- and between-cluster effects. These can produce different coefficients and different conclusions from identical data, so the choice must be stated and justified.
How many clusters you have. The constraint that binds is the number of level-2 units, not your total sample. A study of 600 pupils across five schools is, for estimating school-level effects, a study with five data points. Methodological guidance commonly points to something in the region of thirty clusters as a working minimum for reasonable estimation of fixed effects, with more needed for variance components and random slopes — but the guidance varies by source and by what you are estimating, so cite the recommendation you are following rather than asserting a universal threshold.
With too few clusters, level-2 standard errors are biased downward. Restricted maximum likelihood estimation with a small-sample degrees-of-freedom correction such as Kenward-Roger or Satterthwaite mitigates this and should be reported when used.
When a full multilevel model is not the answer
Recognising clustering does not oblige you to fit a multilevel model. Three alternatives are legitimate, and saying which you chose and why is what a marker is looking for.
Cluster-robust standard errors. If clustering is a nuisance to be corrected rather than a phenomenon to be studied, robust standard errors adjust the inference without modelling the hierarchy. This is the standard move in econometrics and is entirely defensible when you have no research question at the cluster level.
Fixed effects for cluster. Entering cluster as a set of dummy variables absorbs all between-cluster differences. It is simple and robust, but it consumes degrees of freedom and makes it impossible to estimate the effect of any cluster-level variable.
Aggregating to the cluster level. Analysing school means rather than pupils is valid, but discards all within-cluster variation and reduces your sample to the number of clusters. Reserve it for questions genuinely posed at the higher level, and never interpret the results as though they applied to individuals.
What is not legitimate is the fourth option: noticing the clustering and proceeding with ordinary regression anyway without comment.
Fitting one
Multilevel models are available in every major package. SPSS provides them under Analyze > Mixed Models > Linear. In R the standard route is the lme4 package. Stata, MLwiN and HLM all support them, the latter two being purpose-built for this class of model.
The conventional sequence is incremental and each step earns its place in the write-up:
- Fit the empty model and obtain the ICC. If it is effectively zero and your design is not clustered by construction, you may be able to justify a single-level analysis.
- Add level-1 predictors with a random intercept.
- Add level-2 predictors — the cluster-level variables.
- Test random slopes for the level-1 predictors where theory suggests the effect should vary.
- Test cross-level interactions if your research question requires them.
Compare successive models with a likelihood ratio test on the change in deviance, and be aware that models differing in their fixed effects must be compared under full maximum likelihood rather than REML.
Reporting a multilevel model
A results section for a multilevel analysis reports more than a regression table, and omitting these elements is the commonest weakness in student write-ups:
- The data structure — how many level-1 units, how many level-2 units, and the average and range of cluster sizes.
- The ICC from the empty model, as the justification for the whole approach.
- The fixed effects with standard errors, confidence intervals and p-values, exactly as you would for any regression.
- The variance components at each level, and how they change as predictors are added.
- The estimation method (ML or REML), any small-sample correction, and the software and version.
- Your centering decision and its rationale.
Recognising the problem early
The practical value of this material is upstream of the analysis. Ask one question when you design your sampling: did my participants arrive individually, or in groups?
If they arrived in groups — because you recruited through institutions, classes, wards or teams, as most student researchers must — then your data are clustered whether or not you intend to model the clustering. Recording the cluster identifier for every participant costs one extra column in your spreadsheet and preserves every option. Discovering the hierarchy after data collection, with no cluster variable recorded, closes all of them.
The multiple regression guide lists independence of errors as one of the five assumptions; this is the situation that violates it, and the remedy the assumption implies. For choosing your analysis in the first place, the statistical test decision guide and the quantitative research methods guide map the wider terrain, and if your question is about latent constructs as well as hierarchy, structural equation modelling can be extended to multilevel data.
When the modelling is settled and the methodology chapter has to explain all of this to an examiner, Tesify can help you turn the technical decisions into the justified, readable prose that a methodology section is marked on.
Write your thesis with AI
Structure, draft, cite, and format your thesis faster with Tesify’s AI writing tools, automatic bibliography, and plagiarism checker. Free to start, no credit card required.






Leave a Reply