

A marketing results chapter that dumps every survey question’s frequencies in the order they were asked, with no structure connecting the data to the thesis’s hypotheses, is one of the most common ways a well-designed study loses marks in the writing stage. This guide covers how to structure marketing survey results properly: descriptive statistics first, the right figure for each kind of analysis, how to report regression or SEM output in tables examiners can actually read, and the mistakes that turn good data into a weak chapter.
Start with descriptive statistics and sample demographics
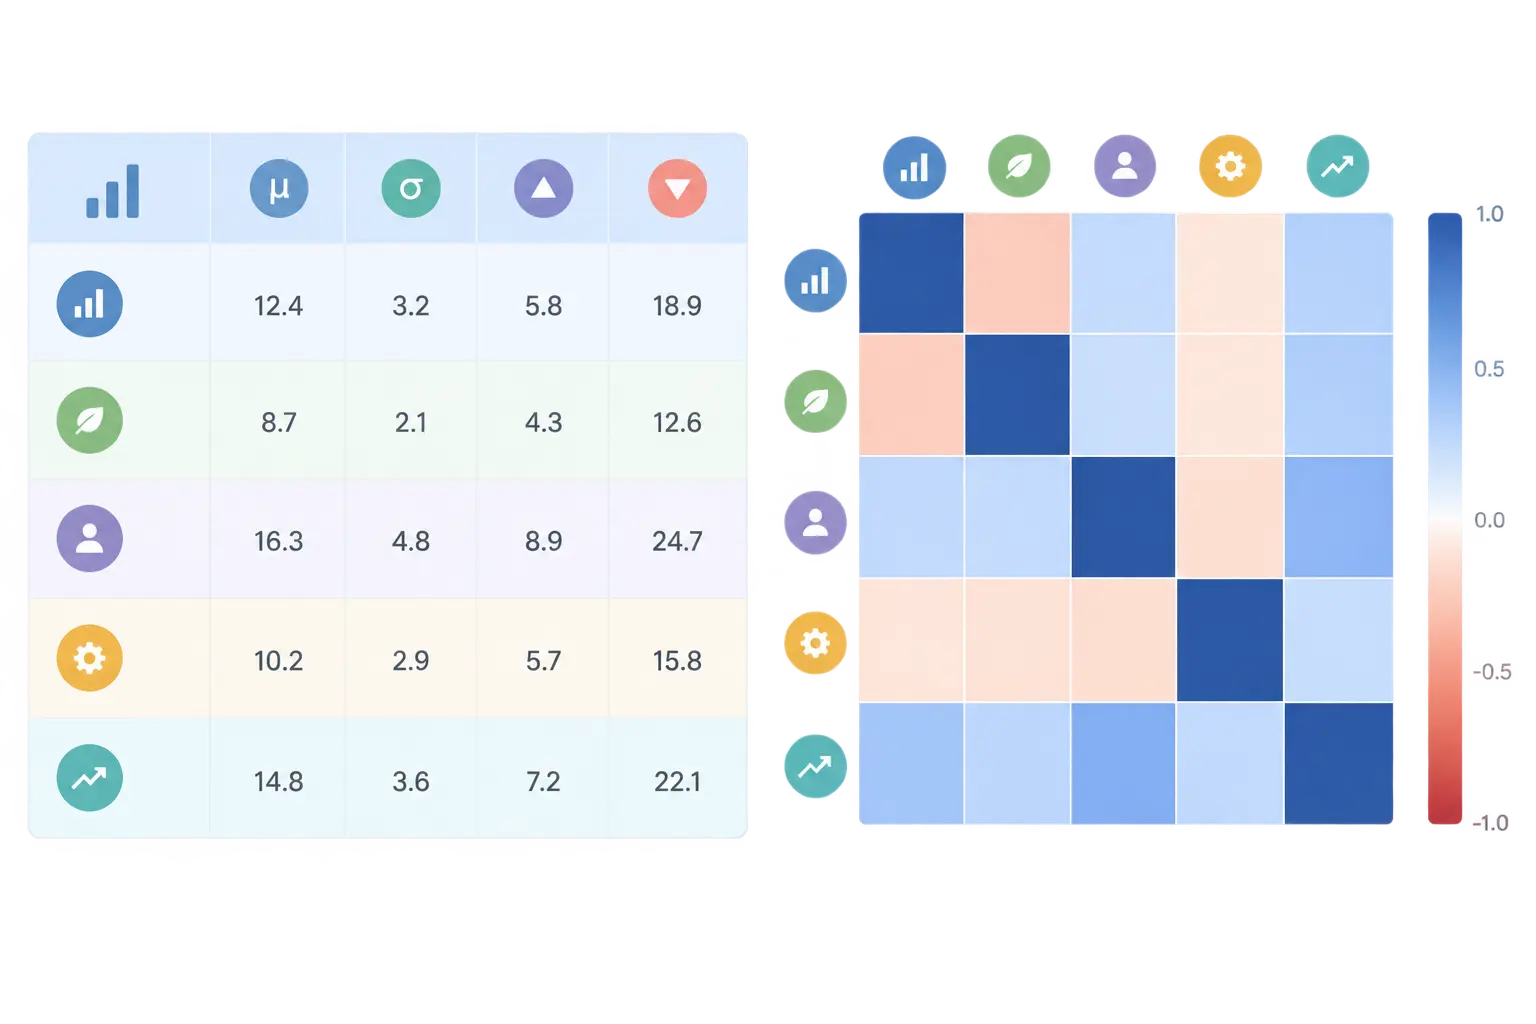
Before any inferential analysis, present a table of sample demographics and key descriptive statistics — mean, standard deviation, and range for continuous variables; frequency and percentage for categorical ones. This table does two jobs: it lets a reader judge who actually responded (and therefore how far findings might generalize) before seeing what the data shows, and it is where you address response rate and any non-response bias consideration directly, rather than burying that discussion in the methods chapter alone. A results chapter that jumps straight to hypothesis-testing output without this orientation forces the reader to work backward to understand the sample.
A correlation matrix before regression or SEM
Presenting a correlation matrix between your key study variables, before the regression or structural model results, is standard practice in marketing quantitative research for two reasons: it gives the reader a reader-friendly overview of how variables relate before the more complex model output, and it functions as a practical check on multicollinearity — very high correlations between predictor variables (typically flagged above roughly .80–.85, though the exact threshold depends on your specific model) signal a potential problem for the regression or SEM analysis that follows. Report the correlation matrix in a clearly labeled table with significance markers, not folded into narrative prose.
Reporting regression output correctly
A regression results table should include, at minimum: unstandardized and standardized coefficients (B and β), standard errors, significance levels, and the model’s overall fit statistics (R², adjusted R², F-statistic). Where you are testing multiple hypotheses through a single regression model, map each coefficient explicitly to the hypothesis it tests in the table or the accompanying text — “H1, predicting a positive relationship between attitude and intention, is supported (β = .38, p < .05; illustrative values)” — rather than leaving the reader to match numbers to hypotheses themselves.
Reporting SEM output: two tables, not one
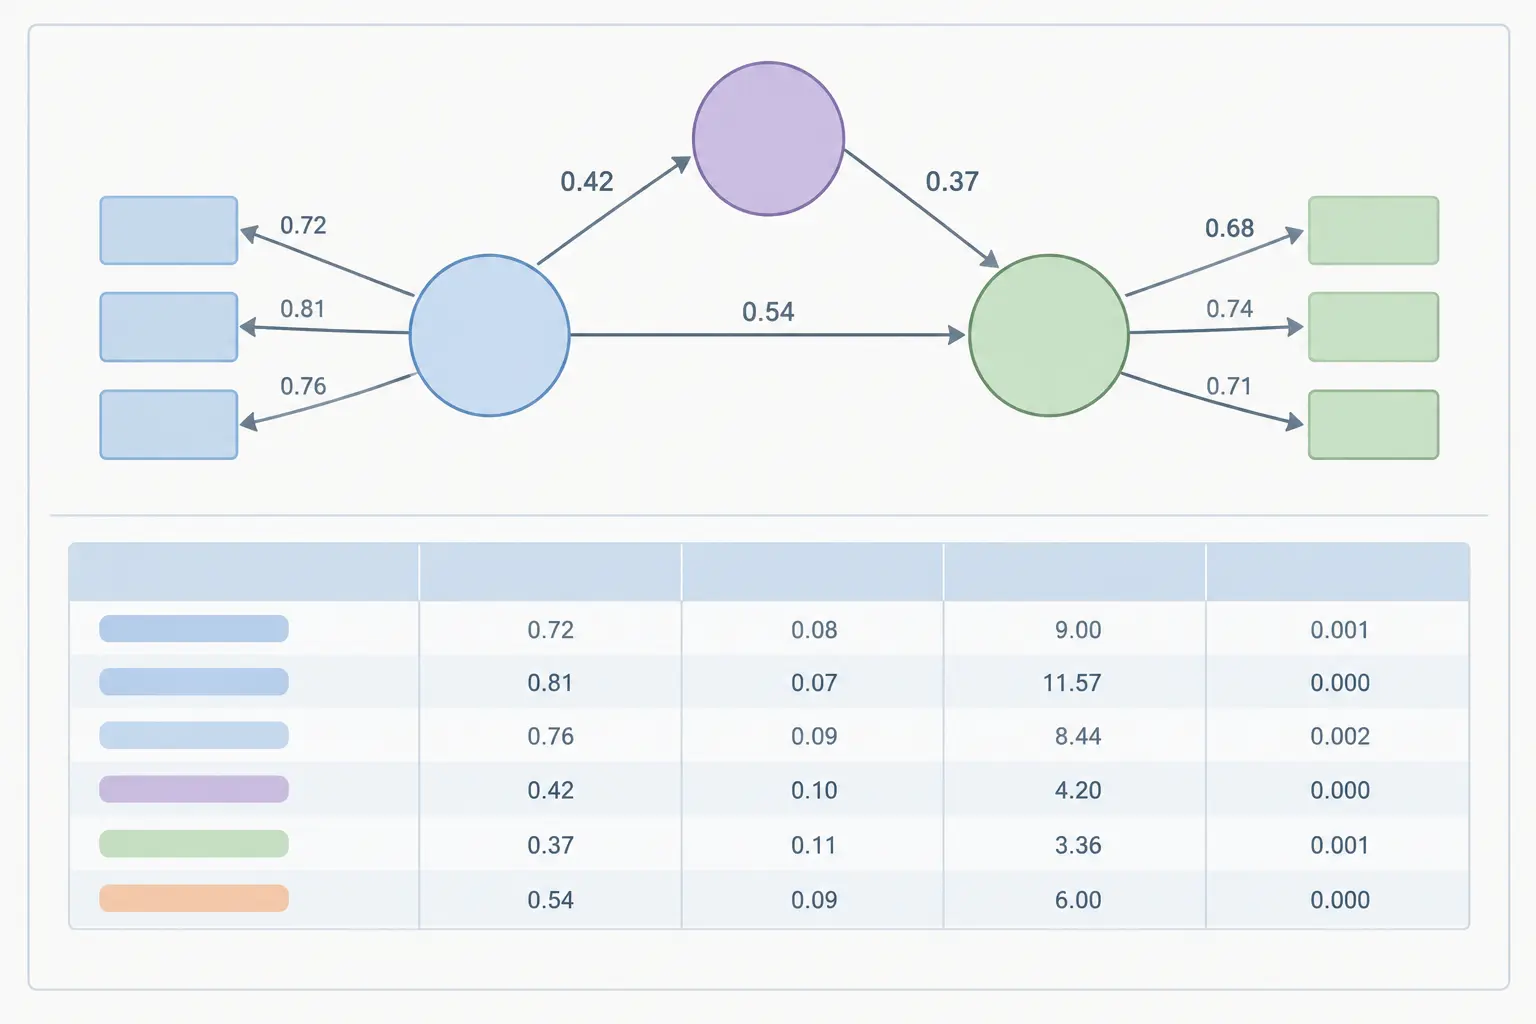
Structural equation modeling results are best reported across two distinct tables rather than folded into one: a path-coefficients table (each hypothesized path, its standardized coefficient, standard error, and significance) and a model-fit table (CFI, RMSEA, SRMR, and any other fit indices your program or target journal expects), since these serve different reader questions — does each specific hypothesis hold, and does the overall model fit the data well. Our guide to CB-SEM versus PLS-SEM covers which fit indices apply to which SEM approach, since PLS-SEM and covariance-based SEM report somewhat different fit statistics and conflating the two conventions is a common reporting error.
Effect sizes: report them alongside significance
A marketing results chapter reporting only whether a path or coefficient is statistically significant, without an accompanying effect size, gives an incomplete picture — a large sample can make a trivially small effect statistically significant, and a smaller sample can leave a practically meaningful effect short of conventional significance thresholds. Report standardized coefficients (which double as a rough effect-size indicator in regression and SEM contexts), R² or f² for variance explained, and, where relevant, note explicitly whether an effect that is statistically significant is also large enough to matter practically for the marketing question at hand — a distinction examiners increasingly expect addressed rather than left implicit in a bare significance statement.
Reporting mediation and moderation results
Where a marketing thesis tests a mediation or moderation hypothesis — common in consumer-behaviour research — the results table needs to show more than a simple direct-effect coefficient: for mediation, report the direct effect, the indirect effect (through the mediator), and the total effect, ideally with bootstrapped confidence intervals for the indirect effect rather than relying solely on a significance test; for moderation, report the interaction term’s coefficient and, where the interaction is significant, a simple-slopes analysis or interaction plot showing how the relationship changes across levels of the moderator. A bare statement that “mediation was supported” without this decomposition leaves the specific mechanism unclear to the reader.
Choosing the right figure for each kind of finding
Marketing survey results support a narrower range of genuinely useful figures than students often assume. What works: a path diagram for SEM results, showing the structural model visually with standardized coefficients labeled on each path — this is the one figure type SEM results specifically call for, and its absence is noticeable in an SEM-based results chapter. A simple bar chart for comparing means across a small number of groups (comparing intention scores across three market segments, for example), and an interaction plot specifically for a significant moderation finding, since a plot communicates an interaction pattern far more clearly than a coefficient table alone. What is used far too often and adds little: pie charts for anything with more than three or four categories (a table communicates the same information more precisely), and decorative infographic-style visuals that restate a single number already reported in text without adding analytical value.
Handling exploratory or incidental findings
A survey inevitably generates findings beyond your stated hypotheses — an unexpected demographic difference, an interesting but unplanned correlation. Keep the main results chapter focused on your stated hypotheses and research questions; move exploratory or incidental findings to a clearly labeled separate section or an appendix, explicitly flagged as exploratory (not pre-registered or hypothesis-confirmatory) rather than presented with the same weight as your planned analysis. Blending exploratory findings into the main results without this distinction overstates their evidentiary weight.
Addressing common method bias directly
Where a marketing thesis measures every construct (independent, dependent, and mediating variables) through a single self-report survey completed by the same respondent at the same time, common method bias — inflated correlation between variables purely because they share a measurement source and method, not because of a genuine underlying relationship — is a standard concern examiners expect addressed. Running Harman’s single-factor test and reporting it as sufficient evidence that common method bias is not a problem is a common but weak move — the test has well-documented limitations and does not rule out bias on its own. A stronger approach discusses procedural remedies used in the design (temporal separation of measures, different response formats, anonymity assurances) alongside any statistical check, rather than relying on Harman’s test in isolation.
Presenting results when your design is mixed-methods
Where a marketing thesis pairs the survey with a qualitative component (open-ended survey items, follow-up interviews), keep the quantitative and qualitative results visually and structurally distinct sections rather than interleaving them unpredictably, and state explicitly at the start of the results chapter how the two components relate — whether qualitative findings are presented as illustrative context for the quantitative results, or as an equally-weighted parallel strand, or as an explanatory follow-up to a specific quantitative finding that needed further explanation. Naming this relationship explicitly, rather than leaving the reader to infer it, is expected in a mixed-methods marketing results chapter specifically.
A worked example
Weak version: A results chapter listing every survey question’s response frequencies in question order, with a paragraph of narrative description for each, ending with a brief mention that “the hypotheses were generally supported.”
Stronger version: A results chapter opening with a sample-demographics table, followed by a correlation matrix, followed by hypothesis-by-hypothesis regression or SEM output in properly formatted tables with fit statistics, a path diagram for the structural model, and an explicit statement for each hypothesis (supported, not supported, partially supported) tied to its specific coefficient, effect size and significance value.
The second version organizes the chapter around the hypotheses rather than the survey instrument’s question order, which is the structural shift that separates a strong results chapter from a weak one regardless of how good the underlying data actually is.
Building on your theoretical framework’s structure
Where your marketing thesis applies a named theoretical framework — the Theory of Planned Behavior, for example — your results chapter’s organization should mirror the framework’s own hypothesis structure directly, reporting each construct-to-construct path in the order the theory specifies rather than in an arbitrary order. Our guide to applying the Theory of Planned Behavior in a marketing dissertation covers the hypothesis-writing discipline this results chapter should trace back to, and our guide to marketing dissertation scales covers the instrument layer that produced the data you are now reporting.
Mistakes that turn good data into a weak chapter
- No descriptive statistics or demographics table before inferential results.
- No correlation matrix before regression or SEM output.
- Results organized by survey question order instead of by hypothesis.
- SEM results folded into one table instead of separate path-coefficient and model-fit tables.
- Effect sizes omitted, reporting only statistical significance.
- Mediation or moderation results not decomposed into direct, indirect and total effects, or interaction terms without a simple-slopes analysis.
- Pie charts for many-category data where a table would communicate more precisely.
- Exploratory findings presented with the same weight as pre-planned hypothesis tests.
- Common method bias addressed only with Harman’s single-factor test, with no procedural remedies discussed.
- Quantitative and qualitative results interleaved without stating how the two components relate.
Frequently asked questions
What comes first in a marketing survey results chapter?
Descriptive statistics and sample demographics, presented in a table, before any inferential analysis, so the reader understands who responded before seeing what the data shows.
Should I report a correlation table before regression or SEM results?
Yes, a correlation matrix between key variables is standard practice before presenting a regression or structural model, both as a check on multicollinearity and as a reader-friendly overview.
How do I report structural equation modeling results in a table?
Report path coefficients, standard errors, and significance for each hypothesized path in one table, alongside model fit indices (CFI, RMSEA, SRMR) in a separate table or a clearly labeled section.
Should I include every survey question’s results, or only the ones relevant to my hypotheses?
Only the ones relevant to your hypotheses and research questions in the main results chapter; move exploratory or incidental findings to an appendix or a clearly labeled separate section.
What is common method bias and do I need to address it in my results chapter?
Common method bias is inflated correlation between variables measured from the same source at the same time using the same method. A marketing thesis using a single self-report survey for all constructs should address it directly, not just run Harman’s single-factor test and consider the issue closed.
Do I need to report effect sizes, or is significance testing enough?
Report both. A large sample can make a trivially small effect statistically significant, so an effect size lets a reader judge whether a significant finding is also practically meaningful.
How should I report a mediation finding?
Report the direct effect, the indirect effect through the mediator, and the total effect, ideally with bootstrapped confidence intervals for the indirect effect, rather than a bare statement that mediation was supported.
Turn your marketing survey data into a results chapter that reads as analysis
Tesify’s thesis workspace, used by 9,000+ students and 15,000+ chapters, helps marketing researchers structure a results chapter around hypotheses rather than survey question order. Every word stays 100% written by you.
Write your thesis with AI
Structure, draft, cite, and format your thesis faster with Tesify’s AI writing tools, automatic bibliography, and plagiarism checker. Free to start, no credit card required.






Leave a Reply