

CB-SEM vs PLS-SEM (2026): Which Structural Equation Modelling Method Should Your Thesis Use?
Your supervisor says use AMOS. A paper you are building on used SmartPLS. A methods textbook implies one of them is a compromise. All three can be right, because CB-SEM and PLS-SEM are not competing implementations of the same technique — they estimate different things and answer different questions. This is the comparison that decides which one belongs in your methodology chapter, and how to defend the choice when it is challenged.

The difference in one sentence
CB-SEM asks whether your theoretical model can reproduce the covariances you observed. PLS-SEM asks how much variance in your outcome your model can explain. Confirmation versus prediction. Almost every other difference between them follows from that.
What each method actually estimates
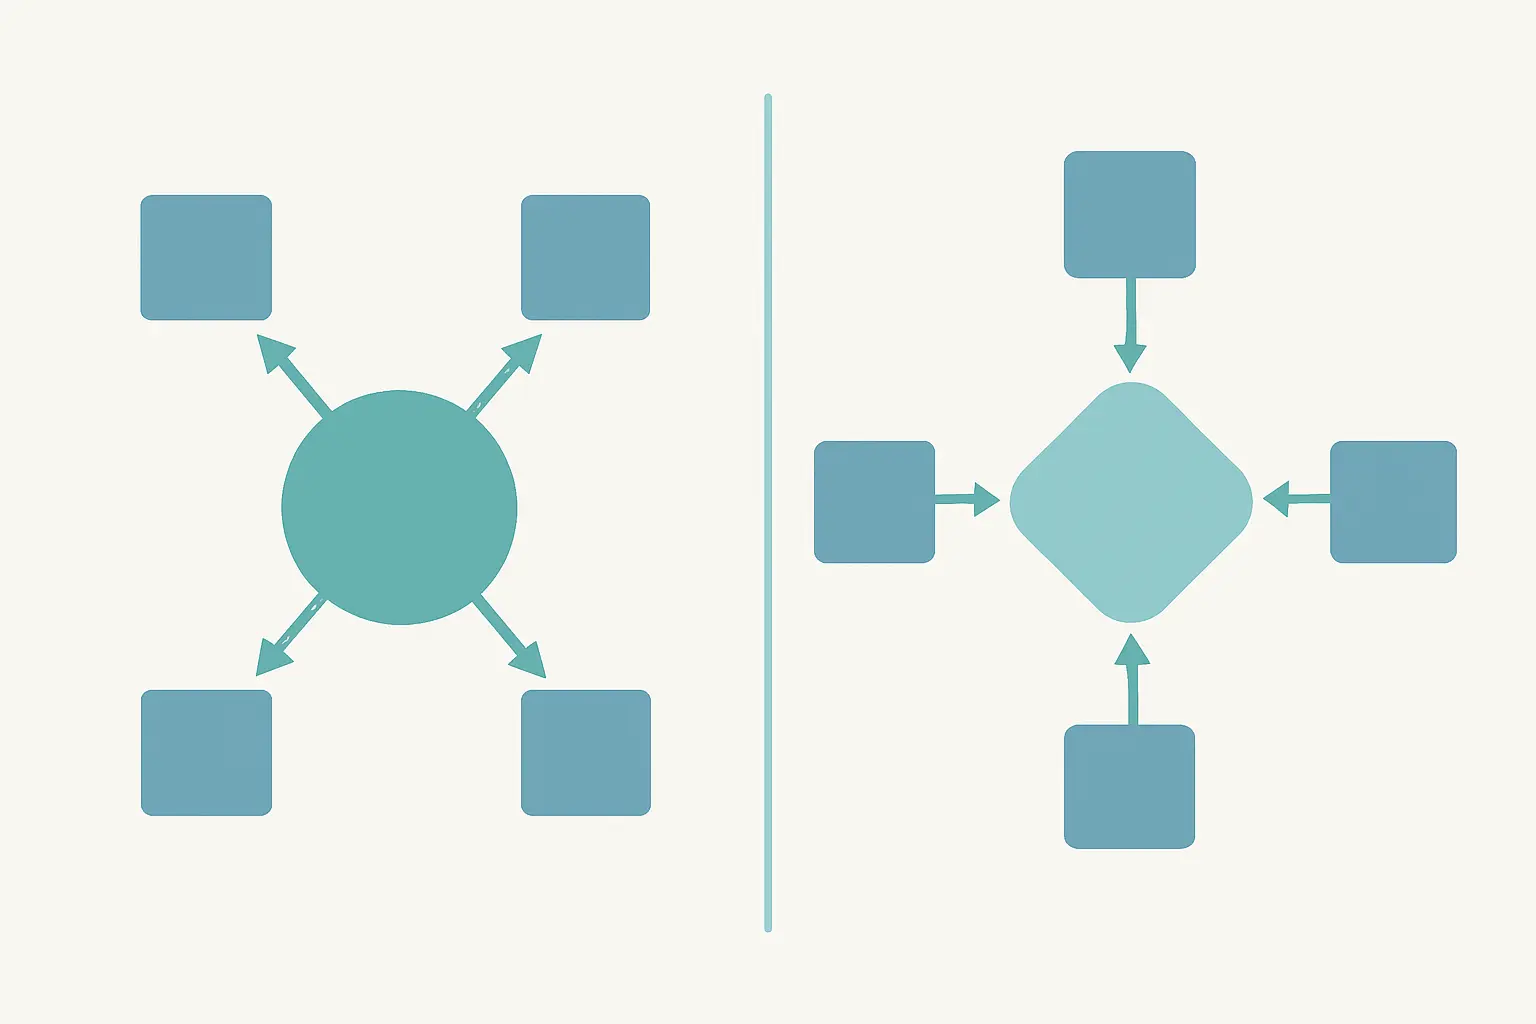
This is the part most guides skip, and it is the part that makes the rest make sense.
CB-SEM estimates common factors. It assumes a latent variable genuinely exists and causes the covariation among its indicators. It estimates the model parameters that best reproduce the observed covariance matrix, and then reports how close that reproduction came — which is what a fit index is. Because it models measurement error explicitly, its parameter estimates are consistent estimates of the true factor relationships when the model is correctly specified.
PLS-SEM estimates composites. It forms each construct as a weighted sum of its indicators, chosen to maximise the explained variance of the downstream constructs. There is no assumption that a common factor exists behind the items. This is why PLS-SEM has no meaningful global fit test: it never tried to reproduce the covariance matrix, so measuring how well it did would be measuring the wrong thing.
The practical consequence: PLS-SEM path estimates are biased relative to the common-factor model — conventionally described as slightly conservative for structural paths and slightly inflated for loadings — a property known as PLS bias, which shrinks as sample size and the number of indicators grow. Whether that bias matters depends entirely on whether the common-factor model is what you believe in.
Side by side
| Dimension | CB-SEM | PLS-SEM |
|---|---|---|
| Objective | Confirm theory; reproduce the covariance matrix | Predict and explain variance in target constructs |
| Construct estimated | Common factor | Composite (weighted sum of indicators) |
| Typical software | AMOS, Mplus, lavaan, LISREL, Stata sem | SmartPLS, ADANCO, R (seminr, plspm) |
| Global fit indices | Yes — chi-square, CFI, TLI, RMSEA, SRMR | No meaningful global fit; SRMR only, and contested |
| Distributional assumptions | Typically multivariate normality (ML); robust estimators available | None; significance from bootstrapping |
| Formative constructs | Awkward; needs identification workarounds | Handled natively |
| Model complexity | Strains with many constructs relative to sample | Handles complex models comfortably |
| Sample size demand | Higher | Lower, but not a licence for a tiny sample |
| Improper solutions | Possible (Heywood cases, non-convergence) | Converges reliably |
| Key assessment output | Fit indices, standardised loadings, modification indices | Loadings, AVE, HTMT, R², f², Q² |
The questions that actually decide it

Work through these in order. The first one that gives a decisive answer usually settles it.
1. Is your research objective confirmation or prediction? If you are testing whether an established theory holds in your context and you want to report how well the model fits, that is CB-SEM. If you are explaining variance in an outcome, extending a model, or building toward prediction, that is PLS-SEM. This is the primary criterion and the one your justification should lead with.
2. Do you have formative constructs? If yes, PLS-SEM, unless you are prepared to handle the identification constraints that formative measurement imposes in a covariance-based framework.
3. Is your model large relative to your sample? Many constructs, many indicators, modest N pushes you toward PLS-SEM. A parsimonious model with a healthy sample opens CB-SEM.
4. What does your field expect? This is a legitimate criterion, not a cop-out. Psychology and much of the social sciences default to CB-SEM; information systems, marketing and management increasingly use PLS-SEM. Publishing into a field that distrusts your method means defending it twice.
5. Are your data severely non-normal or your scales coarse? PLS-SEM is distribution-free. But note that this is a weaker argument than it once was: CB-SEM has robust estimators such as MLR and WLSMV that handle non-normality and ordinal indicators well, so “my data are not normal” alone does not settle it.
Sample size: the most misused argument in this debate
“PLS-SEM works with small samples” is the most repeated and least useful claim in the literature. It is true only in the narrow sense that PLS-SEM converges and produces estimates where CB-SEM might not. It does not mean a small sample yields trustworthy conclusions.
A small sample gives wide confidence intervals, unstable path estimates and low power regardless of method. Choosing PLS-SEM because your N is 80 is choosing a method that will not warn you about a problem you still have. The ten times rule — ten cases per the largest number of arrows pointing at any one construct — is no longer accepted as sufficient justification on its own; use a power analysis or the inverse square root method instead, as set out in our sample size and power analysis guide.
Write the justification as a methodological argument, never as a resource constraint. “PLS-SEM was selected because the study is predictive and the model includes formatively measured constructs” is defensible. “PLS-SEM was selected because the sample was small” invites the obvious follow-up.
What you report is completely different
The two methods produce different evidence, and mixing up their reporting conventions is an immediate tell.
A CB-SEM results section reports the measurement model via CFA — standardised loadings, composite reliability, AVE, discriminant validity — then model fit, conventionally chi-square with degrees of freedom and p, plus CFI, TLI, RMSEA with its confidence interval, and SRMR. It then reports standardised path coefficients with standard errors, and it discusses any modification indices you acted on. Our guide to SEM, path models, CFA and fit indices covers this sequence in detail.
A PLS-SEM results section reports loadings, Cronbach’s alpha, ρA, composite reliability and AVE, then HTMT for discriminant validity, then bootstrapped path coefficients with confidence intervals, then R², f² and Q². There is no fit table. Our step-by-step guide to running PLS-SEM in SmartPLS walks the whole sequence with the thresholds.
Notice what does not transfer: reporting RMSEA for a PLS model, or reporting Q² for a CB-SEM model, tells an examiner you followed a template rather than the method.
Can you run both?
Yes, and it is occasionally the strongest option — but only if you frame it correctly. Running both as a robustness check, with one designated in advance as primary and the other reported as a sensitivity analysis, is a legitimate and impressive move. Convergent results strengthen your conclusions; divergent results are themselves informative and usually point at the measurement model.
What is not legitimate is running both and reporting whichever gave you significance. That is a specification search, and because the two methods estimate different quantities, a difference in results is not a tiebreaker — it is a finding you have to explain.
There is also a middle path worth knowing about: consistent PLS (PLSc) corrects the composite estimates toward common-factor values, which narrows the gap where your constructs really are reflective common factors.
What examiners actually challenge
In practice the viva question is rarely “why not the other method?” in the abstract. It is one of these four.
“Why did you choose this method?” — answer with your research objective and your measurement model, not with your sample size or your software licence.
“Your constructs are reflective and your theory is established — why not CB-SEM?” — the hardest version, and it requires a real answer about prediction or model complexity.
“You report no model fit.” — for PLS-SEM, explain that global fit is not defined in the same way because the method does not minimise a fit function, and point to your measurement and structural criteria instead.
“Is your measurement model justified?” — this is where the reflective/formative decision is examined, and where exploratory work matters. If your scale is new or adapted, prior exploratory factor analysis and a documented reliability assessment make the answer straightforward. If you are extending a technology acceptance model, our comparison of TAM and UTAUT covers the upstream theory choice.
Frequently asked questions
Is PLS-SEM a “lesser” form of SEM?
No, though the debate is real and sometimes heated. Methodological critics argue PLS-SEM is not a latent variable technique at all because it estimates composites rather than common factors. Proponents argue that composites are the appropriate model for many constructs and that prediction is a legitimate objective. Acknowledge the debate in your methodology rather than pretending it does not exist.
Which method do I need for mediation analysis?
Both handle mediation well, using bootstrapped indirect effects. The choice should be made on the criteria above, not on the presence of a mediator.
My supervisor wants AMOS but my model has formative constructs.
Raise it explicitly, because formative measurement in CB-SEM requires identification constraints such as the MIMIC specification and is genuinely awkward. Bring the measurement-model argument, not a software preference.
Can I use PLS-SEM for a purely confirmatory study?
You can, and confirmatory composite analysis exists for exactly that purpose, but if your goal is to confirm an established theory with reflective constructs and report fit, CB-SEM is the more natural instrument.
Does PLS-SEM require normally distributed data?
No. Significance comes from bootstrapping rather than a theoretical distribution. Extreme skewness can still affect estimates, so screen your data either way.
What is PLS bias and should I worry about it?
PLS-SEM estimates deviate from common-factor parameters — typically underestimating structural paths and overestimating loadings — and the deviation shrinks with larger samples and more indicators per construct. It matters if the common-factor model is what you believe in; if you are modelling composites deliberately, it is not bias at all. Consistent PLS is available if you want the correction.
Which is better for a small sample?
PLS-SEM will produce estimates where CB-SEM may fail to converge, but neither makes an underpowered study sound. Justify the sample independently of the method.
Do I need to report why I did not use the other method?
A sentence or two, yes. Naming the alternative and giving the reason you rejected it demonstrates that the choice was made rather than inherited, and it pre-empts the most predictable question in the viva.
Make the justification part of the chapter, not an afterthought
The method justification is one short passage that carries a great deal of weight, and it is usually written last, under pressure, after the analysis is already done. Tesify helps you build the methodology chapter alongside the decisions themselves, so the reasoning is recorded while it is still fresh — 100% written by you.
Write your thesis with AI
Structure, draft, cite, and format your thesis faster with Tesify’s AI writing tools, automatic bibliography, and plagiarism checker. Free to start, no credit card required.






Leave a Reply