
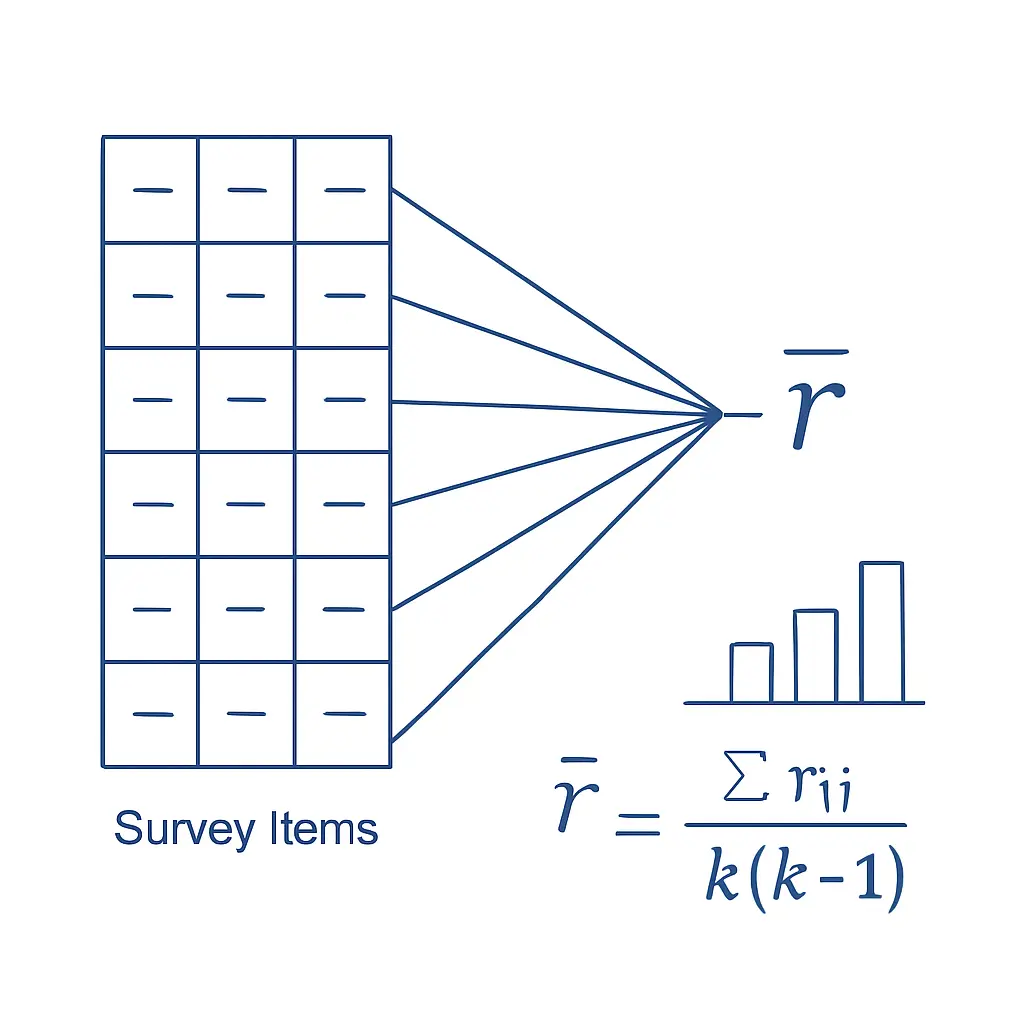
Cronbach’s Alpha Explained in 2026: How to Calculate, Interpret and Report Reliability
Your supervisor has just reviewed your pilot data and asked the question that stops many early-stage researchers in their tracks: “What is the alpha?” Cronbach’s alpha is one of the most cited coefficients in social-science research, yet it is also one of the most routinely misapplied — computed without examining its assumptions, reported without item-level detail, and trusted as an indicator of unidimensionality when it measures nothing of the sort.
This guide offers a methodologically rigorous, practically focused account of Cronbach’s alpha for 2026. It covers the formula and the intuition behind it, step-by-step calculation in SPSS, JASP, and R, the accepted threshold conventions and the reasons they need contextual interpretation, the tau-equivalence assumption that underpins the coefficient’s validity, why very high values can signal a problem rather than excellence, the case for McDonald’s omega as a complementary or preferred statistic, and an exact APA 7 reporting template ready for your Methods or Results section.
What is internal consistency reliability?
Reliability is the degree to which a measurement instrument produces consistent, reproducible results. The broader framework of reliability and validity in research encompasses several distinct subtypes: test-retest reliability (consistency over time), parallel-forms reliability (consistency across equivalent versions), and internal consistency reliability (consistency across items within a single administration).
Internal consistency applies specifically to scales composed of multiple items intended to tap the same latent construct — an unobservable theoretical variable such as anxiety, academic self-efficacy, or organisational commitment. When items share substantial common variance, they are internally consistent: a respondent who scores high on one item tends to score high on the others. Internal consistency is not synonymous with unidimensionality; a scale can produce a satisfactory alpha while measuring more than one underlying factor if those factors are correlated. The distinction matters, and conflating the two is a frequent methodological error.
Cronbach’s alpha, introduced by Lee Cronbach in 1951, became the dominant statistic for internal consistency because it requires only a single test administration and accommodates items with any number of response options — unlike the Kuder-Richardson Formula 20 (KR-20), which is restricted to binary items.
The formula and its intuition
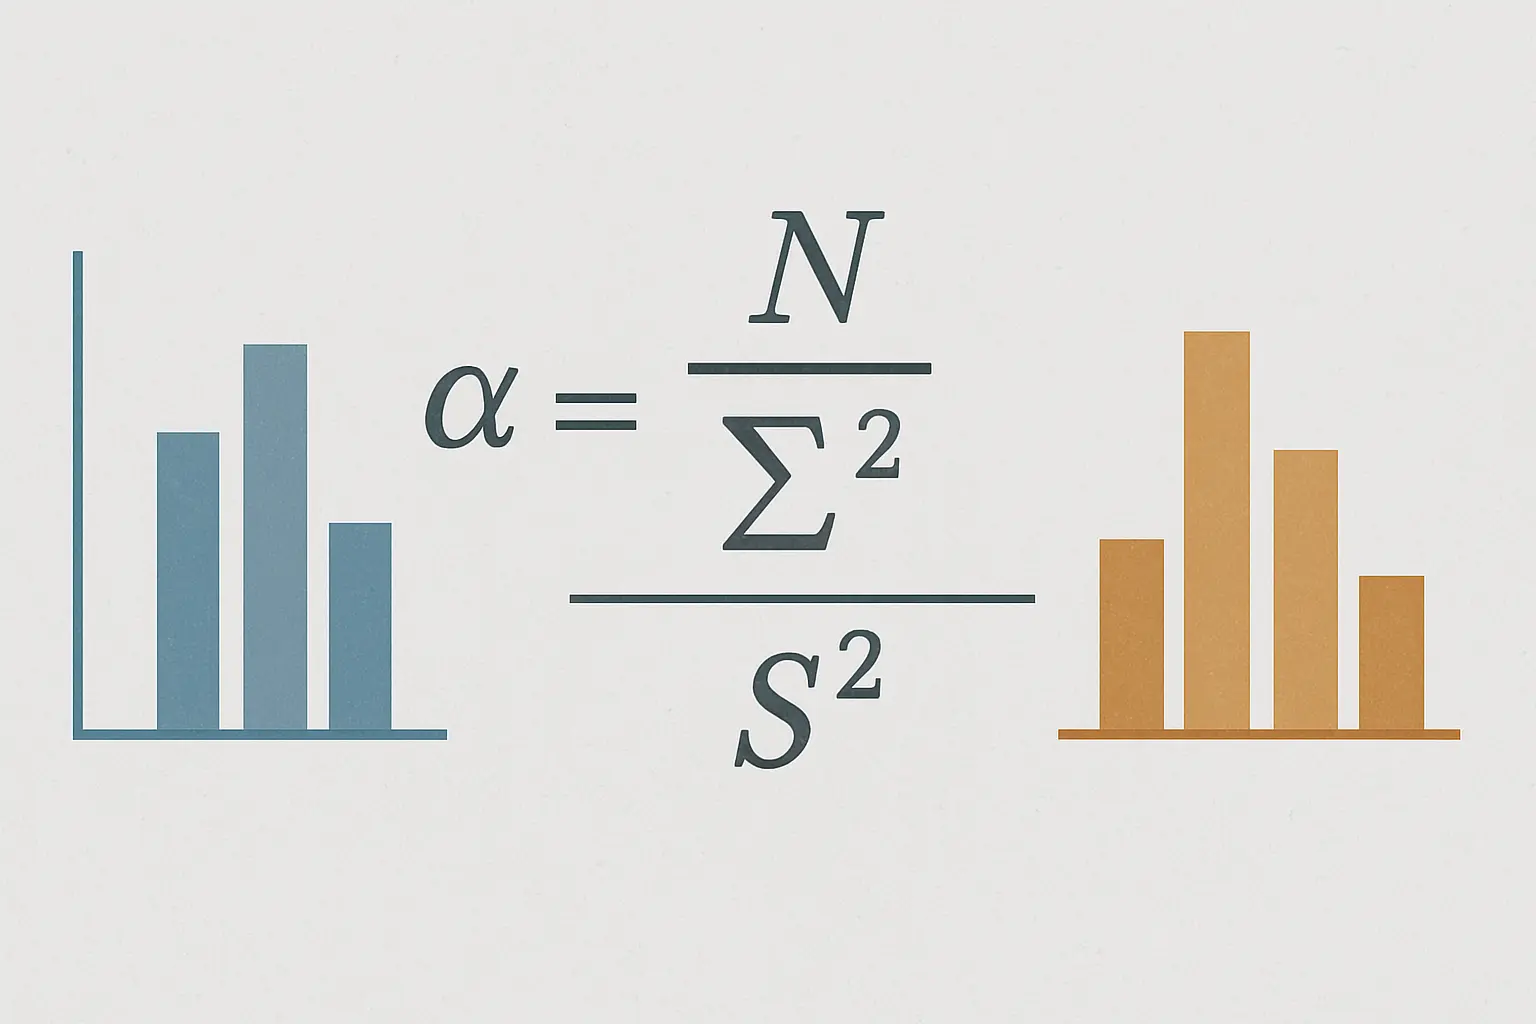
The standard formula for Cronbach’s alpha is:
Where:
- N — the number of items in the scale
- Σσ²i — the sum of the variances of the individual items
- σ²X — the variance of the composite (total) score across all items
The underlying logic is straightforward. If all items measure the same construct, most of the variance in the total score will reflect that shared construct rather than random item-specific error. The ratio Σσ²i / σ²X quantifies the proportion of total-score variance that is not shared across items. Subtracting it from 1 gives the proportion that is shared — the internal consistency estimate. The N/(N−1) term corrects for the inflating effect of scale length: summing more items mechanically reduces error variance, so this factor ensures the estimate is not artificially elevated by having a large number of items.
Mathematically, alpha is equivalent to the mean of all possible split-half reliability coefficients for the scale. It ranges from 0 (no consistency) to 1 (perfect consistency), though values above 1 or below 0 are possible under unusual conditions such as un-recoded reverse items producing negative inter-item correlations.
How to calculate Cronbach’s alpha: SPSS, JASP, and R
SPSS
- Navigate to Analyze → Scale → Reliability Analysis.
- Transfer all scale items into the Items box.
- Confirm the Model dropdown is set to Alpha.
- Click Statistics and check Item, Scale, Scale if Item Deleted, and Inter-Item Correlations.
- Click Continue → OK.
The Reliability Statistics table reports α and the item count. The Item-Total Statistics table provides corrected item-total correlations and the Cronbach’s Alpha if Item Deleted column — both are required for a complete item analysis.
JASP
- Open your dataset and select Reliability → Classical: α, λ6, and ω.
- Move your scale items into the Variables pane.
- Under Scale Statistics, enable Cronbach’s α and McDonald’s ω simultaneously — JASP makes dual reporting straightforward, which is increasingly expected by peer reviewers in psychology and education.
- Enable Item Statistics to obtain item-rest correlations and the alpha-if-deleted values.
R (psych package)
The psych package provides the most complete output for scale analysis:
install.packages("psych")
library(psych)

# df_items: a data frame containing only the scale columns
result <- alpha(df_items)
print(result)
summary(result)

# To compute McDonald's omega in the same session:
omega(df_items)
The alpha() output includes raw alpha, standardised alpha, average inter-item correlation, and the full item-total correlation matrix. Standardised alpha is useful when items are scored on different scales before summing; for Likert scales with consistent response formats, raw alpha is typically reported.
Acceptable thresholds: the .70/.80/.90 benchmarks and their limits
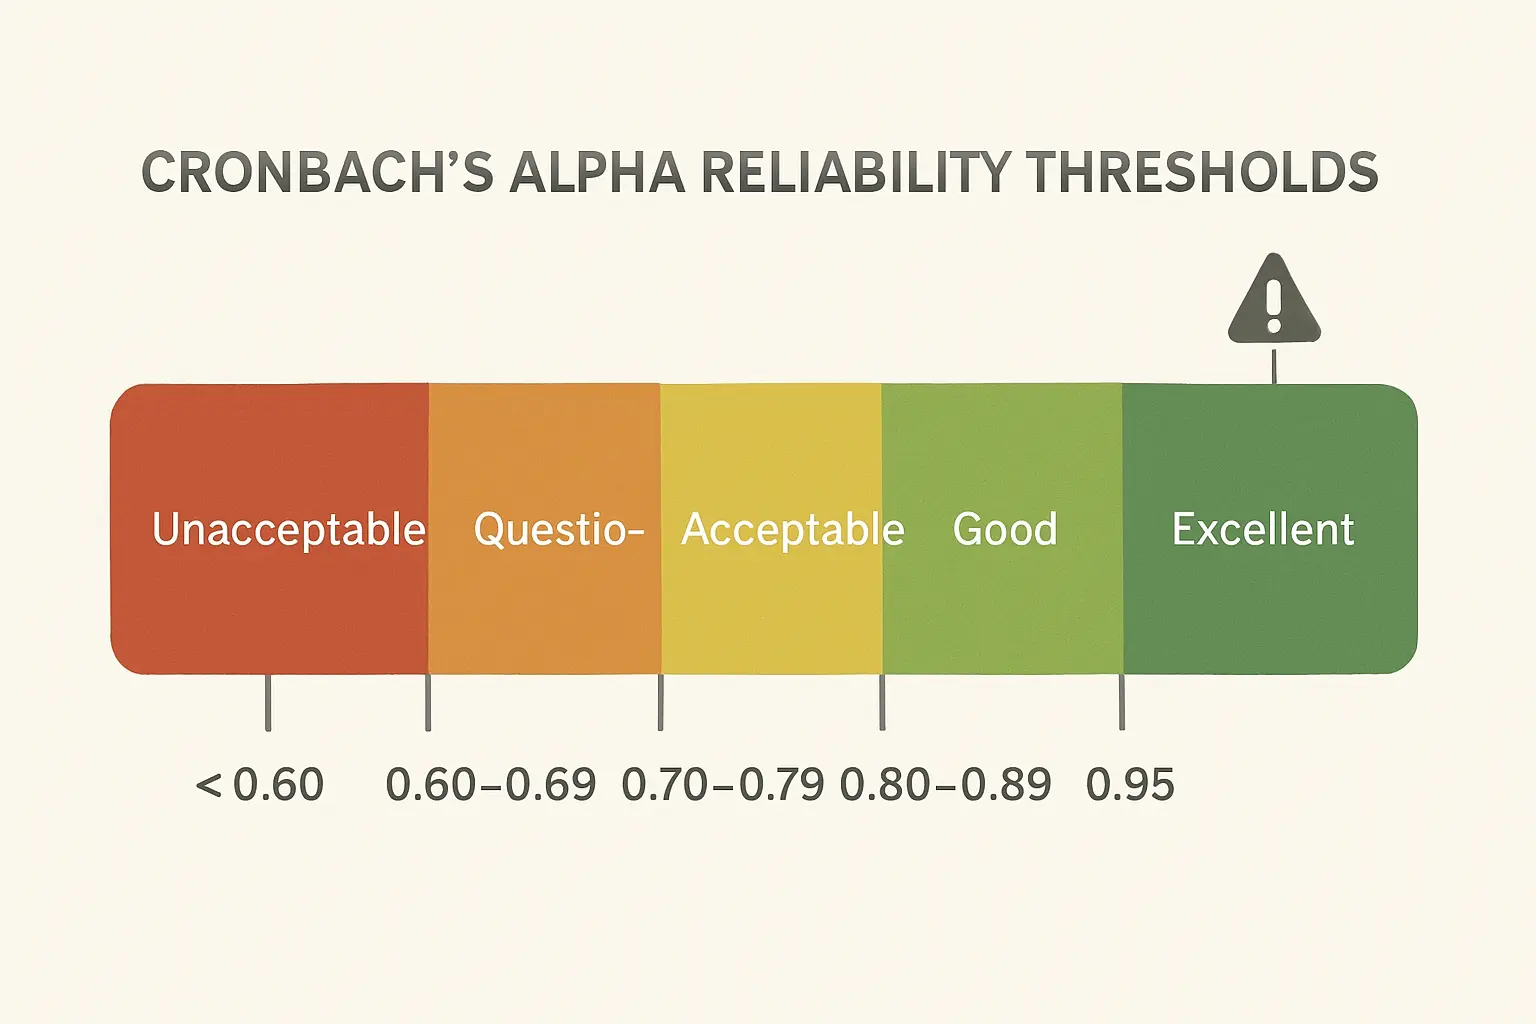
The table below summarises the conventional threshold labels that dominate applied research, drawn primarily from Nunnally and Bernstein (1994) and George and Mallery (2003):
| Alpha range | Conventional label | Typical application context |
|---|---|---|
| < .60 | Unacceptable | Scale requires revision before use in research |
| .60 – .69 | Questionable | Acceptable only in early-stage exploratory piloting |
| .70 – .79 | Acceptable | Standard minimum for published empirical research |
| .80 – .89 | Good | Confirmatory studies and previously validated instruments |
| .90 – .95 | Excellent | Clinical and diagnostic instruments; high-stakes individual decisions |
| > .95 | Potentially problematic | Investigate for item redundancy before proceeding |
These benchmarks are useful defaults, not universal rules. The appropriate minimum for a given study depends on the measurement stakes and the scale’s purpose. A 6-item teaching-quality questionnaire used to inform module feedback does not need to clear the same bar as a clinical depression screen informing treatment allocation. Alpha is also sensitive to scale length: a 30-item instrument will tend to produce higher alpha than a 5-item scale measuring the same construct at the same average inter-item correlation, simply because summation dampens random error. Always contextualise your alpha value with reference to the number of items and the nature of the measurement decision.
When alpha is too high: the redundancy problem
A persistent misconception in applied research is that a higher alpha is invariably better. Values above .95 deserve scrutiny rather than celebration. At that level, items typically correlate so strongly with one another that they are measuring the same content from minimally rephrased angles rather than capturing distinct facets of the construct. This redundancy inflates reliability without adding construct coverage; it can also produce acquiescence bias when respondents assent to a cluster of near-identical items without meaningfully discriminating between them.
When alpha is suspiciously high, examine the inter-item correlation matrix directly. If many pairs exceed .80, the items are effectively duplicates in a psychometric sense. A confirmatory factor analysis (CFA) can quantify whether items are discriminating adequately across the latent factor. In practice, trimming a 20-item scale to 12 well-differentiated items often improves both construct validity and measurement efficiency without sacrificing acceptable reliability.
The tau-equivalence assumption
Cronbach’s alpha is not assumption-free. The critical assumption underlying its validity as a reliability estimate is essential tau-equivalence: every item in the scale must have the same factor loading on the latent construct, meaning each item contributes equally to — and is equally discriminating of — the underlying variable. Under this condition, alpha is an unbiased lower-bound estimate of true reliability.
In practice, items almost never carry equal loadings. Some items discriminate more sharply between high and low scorers; others are weaker indicators of the construct. When loadings are unequal — what psychometricians call the congeneric model — alpha systematically underestimates true reliability. The magnitude of underestimation grows with the spread of item loadings across the scale.
This is not a minor technical caveat. Reviewers and methodologists increasingly flag the tau-equivalence assumption in submitted manuscripts, and failing to address it is grounds for revision in journals that follow contemporary psychometric standards. Testing tau-equivalence formally requires a CFA: fit a constrained model with all loadings held equal and compare it against an unconstrained (congeneric) model using fit indices such as the comparative fit index (CFI) and root mean square error of approximation (RMSEA). If the constrained model fits significantly worse, the assumption is violated and a model-based reliability coefficient is warranted.
McDonald’s omega: the modern alternative
McDonald’s omega (ω), derived from factor-analytic principles in Roderick McDonald’s 1999 monograph, has gained substantial traction as the field has more widely recognised the tau-equivalence limitation of alpha. Unlike alpha, omega uses the actual factor loadings estimated from the data rather than assuming they are equal. It is therefore accurate under the congeneric model that characterises the vast majority of real-world scales.
Two variants appear in the literature:
- Omega total (ωt): the reliability of the composite score, accounting for all sources of common variance including specific sub-factors. This is the most frequently reported version.
- Omega hierarchical (ωh): the proportion of total-score variance attributable exclusively to the general factor, stripping out specific sub-factor contributions. Most informative for multidimensional scales where you want to know how much of the total score is driven by the intended primary construct.
The current methodological position — reflected in recent commentary from psychometric journals and the APA’s statistical reporting guidelines — is that omega should accompany alpha at minimum, and should replace it as the primary reliability estimate when tau-equivalence cannot be established. Many editorial teams and review committees now request justification when only alpha is reported. Since JASP and R’s psych package compute both coefficients within the same analysis call, there is no practical barrier to dual reporting.
The decision rule is simple: if your CFA confirms that item loadings are approximately equal, alpha and omega will be close in value and either is defensible. If loadings vary substantially across items, report omega as the primary coefficient and note the tau-equivalence violation explicitly.
Item-total correlations
Alpha is a scale-level statistic. Item-total correlations reveal the contribution of each individual item. SPSS, JASP, and R all report the corrected item-total correlation — the Pearson correlation between a single item’s scores and the total-scale scores computed without that item, to avoid the item inflating its own association with the total.
The widely accepted minimum for a functioning item is a corrected item-total correlation of ≥ .30. Items below this threshold are not tracking the same underlying construct as the rest of the scale and are candidates for revision or removal. Items above .70 may again signal redundancy with closely parallel items. The Cronbach’s Alpha if Item Deleted column provides a sensitivity check: if removing an item would raise alpha by .02 or more, that item warrants close theoretical scrutiny.
A principled item review process: flag any item with a corrected item-total correlation below .30, or whose deletion would raise alpha by more than .02. For each flagged item, ask whether the content is theoretically irreplaceable. If the item captures a genuinely distinct facet, it may belong to a separate subscale. If it is poorly worded or semantically redundant with another item, remove it.
The quality of your item-level data also depends on how you collect it. The choice of survey platform — Qualtrics, Google Forms, or SurveyMonkey — affects how readily you can export item-level response data for reliability analysis, so build your data management workflow before finalising your instrument design.
How to report Cronbach’s alpha in APA 7
APA 7 (Publication Manual, 7th edition, §4.26) specifies that statistical symbols and abbreviations be italicised. The Greek letter α (not the word “alpha”) is used in text. Report the value to exactly two decimal places, with no leading zero before the decimal point, since alpha cannot exceed 1.0 (e.g., α = .84, not α = 0.84 or α = .8).
A complete in-text report for a scale used as a measure in an empirical study:
“The [Scale Name] demonstrated [acceptable / good / excellent] internal consistency in the current sample (α = .[XX]; k = [N] items). Corrected item-total correlations ranged from .[XX] to .[XX], and no single item deletion would have raised alpha by more than .02.”
When reporting omega alongside alpha to address the tau-equivalence assumption:
“Internal consistency was assessed using both Cronbach’s alpha and McDonald’s omega total, as essential tau-equivalence was not assumed. Reliability estimates were α = .[XX] and ωt = .[XX] (k = [N] items).”
Two common errors to correct before submission: (1) writing “Cronbach Alpha” without the possessive — the correct form is “Cronbach’s alpha”; (2) reporting alpha only in a table note without any prose interpretation of adequacy. Both are flagged in APA Style peer review.
In your dissertation or thesis, reliability statistics for each scale or subscale typically appear in the first paragraph of your Results section, before any inferential findings, or within a dedicated measurement properties table in your Methods chapter. For practical guidance on structuring that section efficiently, see our guide to writing your results chapter.
Finally, it is worth noting what Cronbach’s alpha does not measure. For studies involving agreement between two or more human raters — for example, when two coders independently categorise qualitative data — inter-rater reliability coefficients such as the intraclass correlation coefficient (ICC) or Krippendorff’s alpha are the appropriate statistics. Cronbach’s alpha is strictly a measure of internal consistency across items within a composite scale administered once to a sample.
FAQ
What is a good Cronbach’s alpha value?
A Cronbach’s alpha of .70 is the conventional minimum for exploratory research. Values of .80 and above are considered good for confirmatory and applied research. Clinical instruments where individual-level decisions are made typically require .90 or higher. Values above .95 often indicate item redundancy and should be investigated rather than treated as evidence of superior reliability.
Can Cronbach’s alpha be negative?
Yes. A negative alpha occurs when some items in the scale correlate negatively with others — the most common cause is reverse-scored items that have not been recoded before analysis. Always recode reverse items (so that a high score consistently reflects the same construct direction) before computing alpha.
How many items do you need to calculate Cronbach’s alpha?
Theoretically two items are sufficient, but scales with fewer than four items produce unstable alpha estimates that are highly sensitive to individual item characteristics. Most methodologists recommend at least five to seven items per subscale for a stable and interpretable alpha value.
Should I use Cronbach’s alpha or McDonald’s omega?
Both, wherever feasible. Alpha remains the standard coefficient recognisable to all reviewers and required for comparability with older literature. Omega is more accurate when item loadings differ — which describes most real-world scales. Current best practice is to report alpha for backward compatibility and omega as the primary reliability estimate, noting whether tau-equivalence holds. JASP and R’s psych package compute both in a single analysis step.
Does deleting items to raise alpha actually improve my scale?
Not necessarily. Mechanically removing items to maximise alpha can narrow construct coverage, capitalise on sample-specific variance if based on a single dataset, and diverge from an established validated instrument. Item deletion should be driven by theoretical justification and item-total correlations, not alpha optimisation in isolation. If alpha already exceeds .70, modest deletions rarely change substantive research conclusions.
Does Cronbach’s alpha confirm that a scale is unidimensional?
No. Alpha measures the degree of shared variance across items, not the number of underlying factors. A two-factor scale will produce high alpha if both factors are correlated with each other — the alpha masks the multidimensionality rather than confirming a single dimension. Assessing dimensionality requires exploratory or confirmatory factor analysis conducted separately from the reliability analysis.
Write your thesis with AI
Structure, draft, cite, and format your thesis faster with Tesify’s AI writing tools, automatic bibliography, and plagiarism checker. Free to start, no credit card required.






Leave a Reply