

How to Write Your Results Chapter Faster with AI in 2026 (Without Fabricating Data)
The results chapter stops more students cold than any other part of the dissertation. You have the data — SPSS output, interview transcripts, coded themes — but turning them into clean, APA-compliant prose feels impossible. Every paragraph raises the same question: Am I reporting this correctly, or am I sliding into interpretation? That paralysis costs weeks. Writing your results chapter with AI can cut through it — but only if you use it correctly: to draft structure and prose around your real outputs, never to invent numbers you never collected.
This guide covers exactly what belongs in a results chapter (and what does not), how to structure quantitative and qualitative findings, what APA 7th edition actually requires, and how an integrity-first AI like Tesify speeds up the drafting process without fabricating a single data point. By the end, you will have a repeatable workflow that takes you from raw output to complete draft in a fraction of the time.
Results vs. Discussion: The One Rule That Matters
Before drafting a single sentence, internalise this boundary: the results chapter answers what, the discussion answers why. Examiners at UK and US institutions consistently flag chapters that blur the line — it is the most common structural error in undergraduate and master’s dissertations alike.
In your results chapter, three rules govern every sentence:
- Report, do not interpret. State what the data show in neutral language. Instead of “this suggests participants were overwhelmed by institutional demands,” write “scores on the perceived stress scale ranged from [your minimum] to [your maximum], with a mean of [your M].” Your number, your measure, reported exactly as collected.
- No literature comparisons here. Connecting your findings to prior research belongs in the discussion. If you find yourself typing “consistent with Smith and colleagues (2022),” flag that sentence and move it forward two chapters.
- Selective, not exhaustive. Include every finding that addresses your research questions. Leave out everything that does not. Padding with tangential analyses is a red flag for examiners, not a sign of thoroughness.
If you have already written a discussion draft, reading about how to write your discussion chapter faster with AI will sharpen your sense of where that boundary sits — so you can audit both chapters against it simultaneously.
Structuring Your Results Chapter
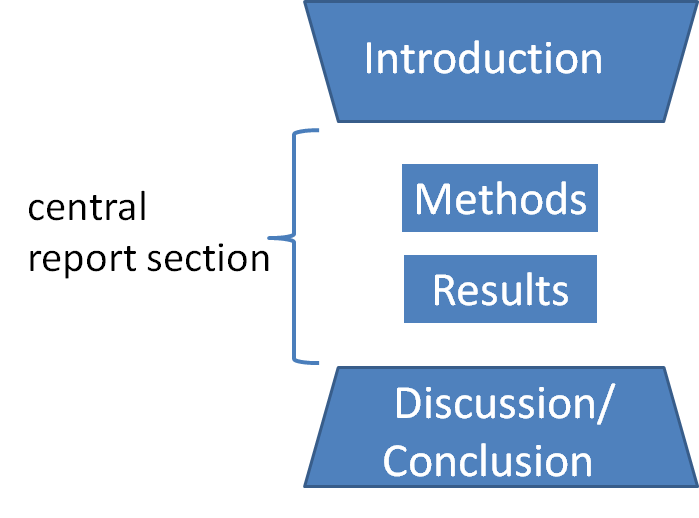
Structure follows methodology. There is no single template that applies to all dissertations, but three frameworks cover the vast majority of cases.
Quantitative studies: by research question or hypothesis
Open with a brief section reporting descriptive statistics for your key variables — means, standard deviations, frequencies, and the characteristics of your sample. Then address each hypothesis or research question in sequence. A reliable order for most quantitative chapters:
- Sample and descriptives. Who participated, what are the basic distributions, are there any missing data patterns to note.
- Assumption checks. Normality (Shapiro-Wilk, Q-Q plots), homogeneity of variance (Levene’s), multicollinearity (VIF values) — briefly, with a sentence on whether assumptions were met.
- Main analyses. One sub-section per research question or hypothesis, presented in the order they appear in your introduction.
- Supplementary or exploratory analyses. Clearly labelled as exploratory so examiners understand they were not pre-registered or hypothesised in advance.
Qualitative studies: by theme or category
Qualitative results chapters are organised around the themes or categories that emerged from your analysis — whether you used thematic analysis, grounded theory, or interpretive phenomenological analysis. Each theme becomes its own sub-section. Within each theme, the standard move is: name and define the theme, present two or more participant quotes as evidence, write a brief analytic commentary connecting that evidence to the theme.
Analytic commentary is not the same as interpretation. Saying “all four quotes express uncertainty about the adequacy of supervisory support” is analytic — it describes a pattern across data. Saying “this reveals a systemic failure in postgraduate pastoral provision” is interpretive — it assigns cause and significance. The second sentence belongs in the discussion.
Mixed-methods studies
Report quantitative and qualitative strands in separate, clearly labelled sections. If your research design calls for integration (convergent or embedded designs), add a brief integration paragraph at the end — but do not force connections prematurely. Save the full integrated interpretation for the discussion. For a deeper explanation of how research design shapes what your results chapter must contain, the overview of qualitative vs quantitative research methods at Tesify covers the decision logic in detail.
Reporting Quantitative Findings in APA 7th Edition
APA 7th edition is specific about how statistics appear in text, and getting the format right is non-negotiable for most supervisors at UK and US institutions. Misformatted statistics — wrong italicisation, missing effect sizes, imprecise p-value notation — create unnecessary corrections at the revision stage.
Inline text format
Report enough information for the reader to evaluate the finding without consulting the table. The core requirements by test type:
- Independent samples t-test: t(df) = value, p = value, d = value, 95% CI [lower, upper]
- One-way ANOVA: F(dfbetween, dfwithin) = value, p = value, η² = value
- Pearson correlation: r(df) = value, p = value
- Multiple regression: R² = value, F(dfmodel, dfresidual) = value, p = value — then per-predictor results in a table
Italicise every statistic symbol. Report exact p values to two or three decimal places — not “p < .05” — unless the value falls below .001, in which case write p < .001. Always pair a significance result with an effect size: d, η², ω², or r depending on the test. APA 7 also strongly recommends reporting 95% confidence intervals alongside point estimates, using the notation 95% CI [lower, upper].
If you need to deepen your understanding of what those intervals actually convey — and how to avoid the common “95% probability” misinterpretation — the article on interpreting confidence intervals correctly walks through the frequentist definition and its implications for reporting.
Tables and figures
Use a table when you have three or more values that would clutter prose. Use a figure when you need to show a trend, distribution, or relationship visually. The APA 7 table rules most students get wrong:
- Label format: “Table 1” (bold, on its own line), followed by a descriptive title in italics on the next line. Number tables sequentially throughout the chapter.
- Borders: No vertical lines. Horizontal lines appear above the column headers, below the column headers, and at the bottom of the table only.
- Notes: Every table needs a “Note.” paragraph below it for abbreviations, significance-level keys, and copyright if applicable.
- Regression tables specifically: Include B, SEB, β, t, p, and 95% CI for every predictor. Reporting only a p-value column is no longer considered best practice under APA 7.
If you are choosing which software to run your analyses in, the comparison of JASP vs Jamovi vs SPSS vs R for thesis statistics covers cost, learning curve, APA output quality, and Bayesian support across all four major options — useful to read before you generate output you will need to format.
What never belongs in quantitative results
Do not report a percentage without its denominator. Do not report a mean without its standard deviation. Do not round p-values to a binary “significant or not” without the value itself. And do not adjust, clean, or improve raw software output to make results look tidier — report exactly what your analysis produced.
Reporting Qualitative Findings
Qualitative results chapters are harder to structure because there is no standard output table to paste in. The risk runs in two directions: over-description (pages of field notes without synthesis) or under-evidencing (claims without supporting quotes). The target is controlled density — each theme supported by at least two pieces of evidence, each piece contextualised in one to three sentences of analytic commentary.
Presenting themes
Open each theme section with a one-sentence definition: what the theme captures across your dataset. Then present evidence in descending order of centrality — your most illustrative quote first, secondary corroboration after. Format participant quotes in italics with a participant identifier: “I never knew who to ask — everyone seemed too busy for basic questions” (P7, postgraduate, UK). Identifiers should be consistent across the chapter but should not identify individual participants.
Analytic commentary
After each block of evidence, write two to four sentences explaining why those quotes exemplify the theme and how they connect to your research question. This is analytic, not interpretive: you are pointing to the pattern in the data, not explaining its causes or societal implications — that move belongs in the discussion chapter.
Negative cases
A credible qualitative results chapter acknowledges deviant or disconfirming cases. If three participants expressed a view that contradicts the dominant theme, report that finding briefly and with evidence. Suppressing contradictory data is a methodological integrity issue, not a stylistic choice. Noting negative cases actually strengthens your analysis by demonstrating rigour.
Where AI Can — and Cannot — Help
The integrity question around AI and the results chapter deserves a direct answer before anything else. There is a sharp line between legitimate assistance and fabrication — and crossing it carries serious consequences.
What AI can legitimately do
| Task | How AI helps |
|---|---|
| Chapter skeleton | Generates section headings and subsection order from your research questions and methodology |
| APA prose conversion | Converts raw SPSS/R/JASP output into correctly formatted APA sentences — no arithmetic involved |
| Theme write-ups | Drafts theme-presentation paragraphs from your codebook and supplied quotes |
| APA format checks | Flags italicisation errors, missing effect sizes, and incorrect p-value notation |
| Breaking the blank page | Produces a first draft — however rough — that defeats the paralysis of starting from nothing |
What AI must never do
AI must never generate statistical values you did not collect. It must never fill in missing data, nudge results towards significance, or fabricate participant quotes. These are not stylistic concerns — they are research integrity violations that can result in degree revocation under the academic misconduct policies of every major UK, US, Australian, and Irish institution.
Any AI tool that offers to “write your results for you” without requiring your actual data is offering fabrication, not assistance. The results chapter is the chapter where your original data live — it is the primary evidence that your research actually happened.
How Tesify is built differently
Tesify is an integrity-first AI thesis assistant. You supply the research — your SPSS output tables, your coded themes, your participant quotes, your research questions — and Tesify builds the writing infrastructure around them. It drafts structure, converts output to APA prose, and writes theme presentations. It never invents values, rounds numbers, or fills in missing cells. If you are curious about the same principle applied to an earlier chapter, the guide on writing your literature review faster with AI shows the same workflow in action for the synthesis phase.
Step-by-Step: Drafting Your Results Chapter with Tesify
Here is a concrete workflow that takes you from raw outputs to a complete, formatted draft.
Step 1 — Assemble your raw materials before opening any AI tool
Collect everything in one place: your research questions numbered in order, your full statistical output files (copy the relevant tables from SPSS, JASP, or R), your coded thematic framework with representative quotes labelled by participant, and any figures or graphs you have already generated in your analysis software. AI works on what you give it. Incomplete inputs produce incomplete drafts.
Step 2 — Generate the chapter skeleton
In Tesify, describe your methodology, research questions, and how many analyses you ran. Ask it to generate a results chapter outline: major sections, subsection order, and approximate word-count allocation per section. Review and adjust the skeleton before writing any prose. Time spent here prevents painful restructuring later — the architecture of the chapter determines whether examiners can follow your logic.
Step 3 — Populate one section at a time
Work sequentially. For a quantitative sub-section: paste the output table, state the hypothesis being tested, and ask Tesify to draft the APA-formatted prose around your values. For a qualitative theme: paste your theme name, its definition, and two or three quotes with participant identifiers, and ask for a theme-presentation paragraph. Review every output sentence against your actual data before accepting it — AI converts format accurately but you are the only person who can verify the substance.
Step 4 — Run a results/discussion boundary check
Once the full draft is written, read it specifically looking for interpretive language. Flag every sentence that speculates about why a result occurred, what it means for practice, or how it compares to the literature. Those sentences belong in the discussion, not here. Moving them simultaneously strengthens both chapters. For the discussion workflow, see the guide on writing your discussion chapter faster with AI.
Step 5 — Run an originality self-check
Before submission, run the results chapter through Tesify’s originality check. The most common source of unexpected similarity flags in results chapters is not deliberate copying — it is over-reliance on the methodology chapter’s language when describing measures and instruments. That is a subtle form of self-overlap that most students never anticipate. Tesify surfaces it so you can paraphrase before the chapter reaches your supervisor or institution’s plagiarism detection system.
Stop staring at a blank results chapter
Tesify builds your results chapter structure around your actual data — APA-formatted prose, table scaffolding, and theme presentations — without fabricating a single number. Free to start, no credit card required.
If your deadline is pressing and you need to move across all chapters quickly, the thesis first draft in a weekend workflow shows how to sequence the full dissertation — including the results chapter — in a concentrated two-day sprint.
Frequently Asked Questions
How long should a results chapter be?
Most results chapters represent roughly 15% of total dissertation length. For a 15,000-word master’s dissertation, that is approximately 2,000–2,500 words of prose plus tables and figures. Undergraduate dissertations of 8,000–10,000 words typically have results chapters of 1,000–1,500 words. Length is driven by the number of research questions addressed, not by a desire to appear thorough — padding with tangential analyses is a common examiner red flag.
Can I combine results and discussion in one chapter?
In qualitative research, combined findings-and-discussion chapters are sometimes accepted and can work well when analytic and interpretive moves are tightly integrated. In quantitative research, most UK and US universities expect them separated. Check your department’s dissertation handbook or ask your supervisor explicitly before deciding. If you do combine them, signal the structural choice clearly in your methodology chapter so examiners are not surprised.
Can AI write my results chapter without my real data?
No — and any tool that offers to do so is inviting you to fabricate research findings. AI can only help structure and draft prose around the real data you supply. Tesify is built on this principle: you input your actual statistical outputs or coded themes; the AI formats, structures, and phrases them correctly. Invented data in a results chapter is an academic integrity violation regardless of how it was generated, and carries the same consequences as any other form of misconduct.
What is the correct APA 7 format for reporting a t-test?
APA 7 inline format for an independent samples t-test: t(df) = [your value], p = [exact value], d = [Cohen’s d], 95% CI [lower, upper]. Italicise t, p, and d. Report the exact p-value to two or three decimal places — not “p < .05” — unless the value falls below .001, in which case report as p < .001. Always include an effect size alongside the significance test; APA 7 considers effect size reporting obligatory, not optional.
How many quotes do I need per qualitative theme?
Two is a practical minimum — one primary illustrative quote and one corroborating example from a different participant. Three to five quotes per theme provides richer evidence saturation. Prioritise diversity over volume: quotes from participants with different demographics, roles, or contexts carry more evidential weight than several similar quotes from the same person. Beyond five quotes per theme, returns diminish and the chapter becomes repetitive.
Should results tables go in the main body or an appendix?
Tables that directly address your research questions belong in the main results chapter body — never bury key findings in an appendix. Supplementary analyses, full correlation matrices, or assumption-check outputs that readers may want to verify but not read in depth can go in an appendix, referenced from the main text (e.g., “full descriptive statistics are reported in Appendix B”). The rule of thumb: if an examiner would need it to evaluate your argument, it stays in the body.
Write your thesis with AI
Structure, draft, cite, and format your thesis faster with Tesify’s AI writing tools, automatic bibliography, and plagiarism checker. Free to start, no credit card required.





Leave a Reply