

Free Statistical Software for Students in 2026: 15 Tools for Thesis Data Analysis (Ranked List)
Your university’s SPSS licence runs out at graduation — and IBM’s commercial price puts it well beyond most student budgets. The good news is that the landscape of free statistical software for students has never been stronger: open-source tools now match or exceed commercial packages for thesis-level analysis, and several appear in published peer-reviewed methods sections. This ranked list covers 15 genuinely free options — no time-limited trials, no restricted output — with enough detail to choose confidently before your data collection begins.
Before committing to a tool, settle your research design first. If you are still deciding between quantitative, qualitative, or mixed-methods approaches, the guide at Research Methodology 2026: Types, Examples and How to Choose covers the full decision framework. Your methodology determines which statistical tests you need — which then determines which software fits.
Each entry below covers what the tool does, who it suits best, platform support, a direct download link, and one practical tip for thesis use.
For most thesis projects: R + RStudio is the most powerful and widely cited free option; JASP is the fastest route to publication-quality output without writing code; jamovi bridges both. All three support Windows, Mac, and Linux, produce APA-formatted tables, and are completely free with no feature restrictions.
All 15 Tools at a Glance
| # | Tool | Best For | Platform | Coding Required? |
|---|---|---|---|---|
| 1 | R + RStudio | Any discipline | Win / Mac / Linux | Yes (learnable) |
| 2 | JASP | Psychology, Education | Win / Mac / Linux | No |
| 3 | jamovi | Social Sciences | Win / Mac / Linux / Web | No |
| 4 | Python (Jupyter + SciPy stack) | Data Science, ML | Win / Mac / Linux | Yes |
| 5 | PSPP | SPSS users, surveys | Win / Mac / Linux | Optional |
| 6 | G*Power | Sample size & power | Win / Mac | No |
| 7 | Orange Data Mining | ML, visualisation | Win / Mac / Linux | No |
| 8 | PAST | Biology, Ecology | Win (primarily) | No |
| 9 | Gretl | Economics, Finance | Win / Mac / Linux | Optional |
| 10 | GNU Octave | Engineering, Maths | Win / Mac / Linux | Yes |
| 11 | KNIME Analytics Platform | Workflow data science | Win / Mac / Linux | Optional |
| 12 | Epi Info (CDC) | Public Health, Epidemiology | Win | No |
| 13 | SOFA Statistics | Beginners, clean reports | Win / Mac / Linux | No |
| 14 | BlueSky Statistics | SPSS → R transition | Win / Mac | No (R backend) |
| 15 | StatKey | Bootstrapping, intro stats | Web (browser) | No |
The 15 Free Statistical Software Tools, Ranked
1. R + RStudio — The Open-Source Standard
What it does: R is a programming language purpose-built for statistical computing, backed by CRAN’s 20,000+ packages covering everything from simple t-tests to multilevel modelling and survival analysis. RStudio (now Posit) wraps R in an accessible IDE that lowers the barrier for beginners. For thesis work involving structural equation modelling, advanced regression, or meta-analysis, R is the field’s citation standard. Best for: Any discipline. Dominant in psychology, ecology, biomedical science, economics, and data science. Platform: Windows, Mac, Linux. Download: cran.r-project.org (R) and posit.co (RStudio).
Tip: Install tidyverse and rstatix before anything else — these two packages cover 90% of undergraduate and taught-masters analysis tasks with readable, teachable syntax.
2. JASP — Bayesian + Frequentist in One GUI
What it does: JASP, developed at the University of Amsterdam, offers classical frequentist tests and their Bayesian counterparts side-by-side in the same interface. The output resembles SPSS but exports cleaner APA-formatted tables directly. Core modules cover t-tests, ANOVA, regression, factor analysis, reliability, network analysis, and meta-analysis — all without writing a single line of code. Best for: Psychology, education, cognitive science, any discipline where Bayes factors are becoming expected. Platform: Windows, Mac, Linux. Download: jasp-stats.org/download.
Tip: Toggle the Bayesian alternative for each test before finalising your results. Reporting a Bayes factor alongside a p-value is increasingly expected in psychology and education dissertations and can distinguish your thesis from peers.
3. jamovi — The Spreadsheet That Runs R
What it does: jamovi presents your data in a spreadsheet panel with a live results panel alongside it — click an analysis and output updates in real time. Under the hood it runs R, so add-on modules (mediation, power analysis, network analysis) install in one click from the jamovi library. The .omv project format stores data, analysis settings, and output together, providing the reproducibility trail examiners increasingly request. Also available in-browser via jamovi Cloud with no local install. Best for: Undergraduates and taught-masters students; social sciences, nursing, business. Platform: Windows, Mac, Linux, Web. Download: jamovi.org.
Tip: Install the free jpower module for power analysis and medmod for mediation and moderation — both are one-click installs inside the jamovi module library and cover common thesis analysis patterns.
4. Python (Jupyter + pandas + SciPy + statsmodels)
What it does: Python’s scientific stack — pandas, NumPy, SciPy, statsmodels, matplotlib, and seaborn — covers descriptive statistics, hypothesis tests, regression, time series analysis, and machine learning. Jupyter Notebooks combine code, output, and written commentary in a single reproducible document suitable for submission as thesis supplementary material. Anaconda Distribution bundles all essential packages in one installer. Best for: Data science, computational linguistics, bioinformatics, large or complex datasets. Platform: Windows, Mac, Linux. Download: anaconda.com.
Tip: Install pingouin via pip. This single package adds effect sizes, pairwise post-hoc tests, ICC, and circular statistics, all returning clean dataframes that paste directly into your results chapter.
5. PSPP — The GNU Replacement for SPSS
What it does: GNU PSPP is a drop-in substitute for IBM SPSS. It reads and writes SPSS .sav files, accepts SPSS syntax commands, and runs descriptive statistics, t-tests, ANOVA, regression, factor analysis, reliability, and non-parametric tests. If your supervisor shares SPSS data files or your methods course teaches SPSS command syntax, PSPP follows the same logic at no cost. Best for: Survey-heavy dissertations; students whose departments teach on SPSS. Platform: Windows, Mac, Linux. Download: gnu.org/software/pspp.
Tip: PSPP’s chart output is minimal. Run your analysis in PSPP to match your supervisor’s syntax, then export results to CSV and produce publication-quality figures in R or Python.
6. G*Power — Non-Negotiable for Sample Size
What it does: G*Power, developed at Heinrich Heine University Düsseldorf, is the accepted standard for a priori sample size calculation and post-hoc power analysis. It covers F-tests, t-tests, chi-square, z-tests, correlation, and multiple regression. Ethics committees and dissertation examiners now routinely require a power analysis in the methodology chapter — G*Power is the tool for supplying one. Best for: Every quantitative dissertation without exception. Platform: Windows, Mac. Download: psychologie.hhu.de → G*Power.
Tip: Report both an a priori power analysis (planned before data collection) and a sensitivity analysis using your actual achieved N. Reporting both signals methodological rigour to examiners.
7. Orange Data Mining — Visual Machine Learning
What it does: Orange, from the University of Ljubljana, is a visual programming platform where you drag and drop components — data loaders, preprocessing steps, classifiers, and visualisation widgets — onto a canvas and connect them without writing code. It supports supervised learning, clustering, text mining, and bioinformatics add-ons. Best for: Students working with classification, clustering, or text data; education technology, biomedical informatics, marketing research. Platform: Windows, Mac, Linux. Download: orangedatamining.com.
Tip: Use the Scatter Plot widget with colour-coded class output — it exports high-resolution PNG visualisations that drop directly into thesis appendices.
8. PAST — Science’s Portable Free Secret
What it does: PAST (PAleontological STatistics) is maintained by Øyvind Hammer at the Natural History Museum, University of Oslo. Despite the name, it is widely cited in ecology, environmental science, geology, and biology. It covers multivariate methods (PCA, cluster analysis, discriminant analysis), diversity indices, geometric morphometrics, time series, and over 200 statistical tests. Best for: Ecology, biology, environmental science, geology, palaeontology. Platform: Windows (primarily). Download: nhm.uio.no → PAST.
Tip: PAST is a single portable executable — no installation needed. Save it to a USB drive and run it on any university lab computer without administrator rights.
9. Gretl — Free Econometrics
What it does: Gretl (Gnu Regression, Econometrics and Time-series Library) covers OLS, GLS, 2SLS, ARIMA, VAR, panel data models, and cointegration tests — the standard toolkit for economics and finance dissertations. It operates via GUI menus or Gretl script, with R and Python bridges available for extended modelling. Best for: Economics, finance, accounting, political science with quantitative policy analysis. Platform: Windows, Mac, Linux. Download: gretl.sourceforge.net.
Tip: Gretl’s built-in dataset library includes datasets from Wooldridge’s Introductory Econometrics. Test your model specification against these known datasets before running your own dissertation data.
10. GNU Octave — MATLAB Without the Licence
What it does: GNU Octave is a high-level programming language largely compatible with MATLAB. Engineering and mathematics students taught on MATLAB can migrate most existing code directly. Octave excels at matrix operations, signal processing, and numerical methods — common in engineering theses. Best for: Electrical, mechanical, and civil engineering; applied mathematics; signal processing; physics. Platform: Windows, Mac, Linux. Download: octave.org/download.
Tip: Run pkg install -forge statistics inside Octave immediately after installation. This package adds MATLAB-compatible statistical functions and is essential for thesis analysis work.
11. KNIME Analytics Platform — Structured Data Workflows
What it does: KNIME (Konstanz Information Miner) is a node-based data science platform. You build analysis workflows by connecting processing nodes — no row limits, no data caps in the free desktop version. KNIME connects to databases, R, Python, and an extensive extension library. For dissertations drawing on multiple data sources, KNIME documents every transformation step in a visible, auditable workflow. Best for: Business intelligence, health informatics, mixed-source datasets. Platform: Windows, Mac, Linux. Download: knime.com/downloads.
Tip: Export your KNIME workflow as a .knwf file and attach it as supplementary material — this provides a fully reproducible audit trail of every preprocessing and analysis step.
12. Epi Info — The CDC’s Free Public Health Tool
What it does: Developed and maintained by the U.S. Centers for Disease Control and Prevention, Epi Info is used worldwide for outbreak investigation, cross-sectional surveys, case-control studies, and cohort analyses in public health and epidemiology. It bundles a questionnaire builder, database, data entry system, and statistical analysis in one package. Best for: Public health, epidemiology, global health, nursing research involving disease surveillance. Platform: Windows. Download: cdc.gov/epiinfo → Downloads.
Tip: Cite Epi Info’s CDC provenance explicitly in your methodology chapter. Ethics committees and examiners respond positively to software with a named, credible institutional maintainer.
13. SOFA Statistics — Clean Output for First-Time Analysts
What it does: SOFA (Statistics Open For All) is designed for students running their first dissertation analysis. It produces styled HTML reports — significantly cleaner than SPSS’s default output — covering descriptive statistics, t-tests, Mann-Whitney, ANOVA, chi-square, and correlation. SOFA connects to CSV, SQLite, MySQL, and MS Access databases. Best for: Students new to statistics; business, education, and nursing dissertations. Platform: Windows, Mac, Linux. Download: sofastatistics.com.
Tip: When pasting SOFA’s HTML output into Word, use Paste Special → Keep Text Only to strip styling conflicts while retaining all data values.
14. BlueSky Statistics — SPSS Interface, R Engine
What it does: BlueSky Statistics wraps R functions in SPSS-style dialogue boxes — frequencies, crosstabs, regression, reliability, factor analysis — while showing the underlying R code it generates in a transparent syntax panel. Students complete their analysis in a familiar GUI and gradually absorb the R syntax that produced it. Best for: Students transitioning from SPSS; social science, psychology, and business. Platform: Windows, Mac. Download: blueskystatistics.com → Downloads.
Tip: Copy BlueSky’s generated R syntax into your thesis appendix. This demonstrates methodological transparency and reproducible practice — a combination examiners reward.
15. StatKey — Browser-Based Bootstrapping
What it does: StatKey is a free web app from the Lock family at Penn State, built for simulation-based and bootstrap inference. Paste your data into the browser, run bootstrap confidence intervals or randomisation tests, and download the output visualisation — no installation, no account required. For smaller datasets where parametric assumptions are hard to justify, randomisation-based inference is a defensible alternative. Best for: Undergraduate dissertations; introductory statistics; non-normal or small-N data. Platform: Web (any browser). Access: lock5stat.com/StatKey.
Tip: StatKey’s bootstrap distribution plots export as images. Drop them into your results chapter to illustrate sampling variability clearly for a non-specialist examiner.
How to Choose the Right Free Statistical Software for Students
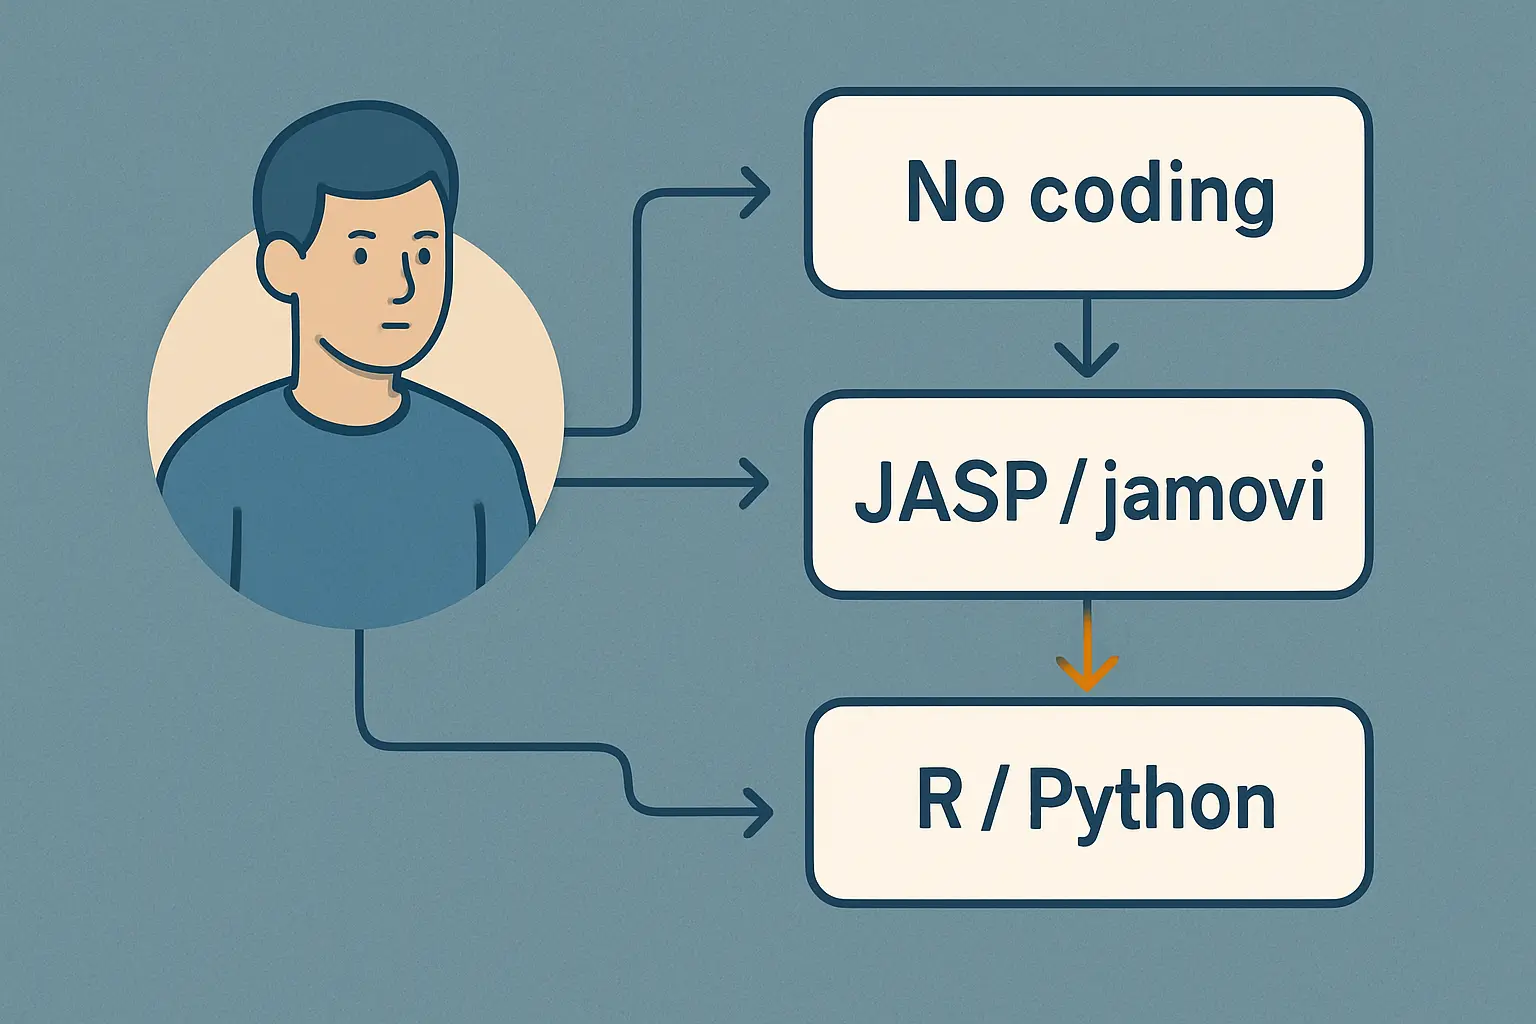
The best free statistical software for students is the one that matches your analysis type, your data structure, and your current coding confidence. Use this decision guide:
- No coding background + quantitative data: Start with JASP or jamovi. Both run the same tests as SPSS with zero command-line work and produce APA-formatted output tables.
- Comfortable scripting: R + RStudio for most disciplines; Python for data science, NLP, or large and complex datasets.
- Economics or finance dissertation: Gretl handles panel data, time series, and cointegration natively — these models are absent or limited in general-purpose tools.
- Biology, ecology, or environmental science: PAST covers multivariate ecology methods that JASP and jamovi do not include.
- Power analysis — always required: G*Power is non-negotiable as a companion tool regardless of which primary software you choose.
- Public health or epidemiology: Epi Info is purpose-built for the study designs your field uses and carries institutional credibility from the CDC.
For mixed-methods projects that combine quantitative and qualitative strands, the step-by-step guide on thematic analysis walks through qualitative coding before any quantification. If your methodology involves rated or coded data, inter-rater reliability measures such as ICC and Krippendorff’s Alpha are available in R, JASP, and Python. Once your analysis is complete, the guide on writing up your results chapter covers how to present statistical output clearly for your examiner without over-interpreting the numbers.
Frequently Asked Questions
Is free statistical software acceptable for a PhD or Master’s thesis?
Yes. R, JASP, and Python appear in methods sections of papers published in Nature, PLOS ONE, and field-specific journals worldwide. What matters to examiners is that you report the software name and version number in your methodology chapter — not whether it carries a commercial licence.
Can I use JASP instead of SPSS for my dissertation?
In most cases, yes. JASP covers the same core tests as SPSS — t-tests, ANOVA, correlation, regression, reliability — and adds Bayesian equivalents. Check with your supervisor first, but JASP is routinely cited in peer-reviewed publications and is accepted at universities across the UK, US, Australia, and Canada.
Do I need coding skills to use these free statistical tools?
Not for most of them. JASP, jamovi, Orange, G*Power, PSPP, Epi Info, SOFA, BlueSky Statistics, and StatKey all operate via menus and dialogue boxes with no command-line input. R, Python, GNU Octave, Gretl, and KNIME all offer GUI options alongside scripting, so you can start clicking and pick up syntax gradually.
Which free tool is best for Bayesian statistics?
JASP is the easiest entry point: it adds Bayes factors to all standard tests via a toggle, with no additional configuration. R users should look at the BayesFactor and brms packages, which support fully custom Bayesian models via Stan. Python users can use PyMC or Stan via CmdStanPy.
How do I cite free statistical software in my thesis?
Report the software name, version number, and an official citation. Most tools publish one: R Core Team (year) for R; JASP Team (year) for JASP; The jamovi project (year) for jamovi. Check the software’s About screen or documentation page for the recommended citation matching your reference style (APA, Harvard, IEEE).
R or Python: which is better for thesis data analysis in 2026?
R is stronger for classical statistical modelling, psychometrics, mixed-effects models, and ecology. Python leads for machine learning, NLP, and large-dataset pipelines. For most social science, health, and humanities dissertations R has a shallower learning curve and more student-focused tutorials. For data science, bioinformatics, or computational research, Python is typically expected by supervisors.
Struggling to Write Up Your Statistical Results?
Choosing the right analysis tool is only half the challenge — presenting statistical findings clearly in your results and discussion chapters is where most students lose marks. Tesify helps you structure and draft those chapters with AI that understands academic conventions, so your analysis communicates clearly to your examiner without over-interpretation or fabrication.
Write your thesis with AI
Structure, draft, cite, and format your thesis faster with Tesify’s AI writing tools, automatic bibliography, and plagiarism checker. Free to start, no credit card required.




Leave a Reply