
Should I Remove Outliers From My Data? (2026)
Usually not, and never because they are inconvenient. Delete an outlier only when you can show it is an error — an impossible value, a data-entry slip, a participant who did not meet your inclusion criteria. A genuine extreme score is data. It belongs in your analysis, and the honest options are to keep it, to use a method that tolerates it, or to report the result both ways.
This is one of the most common questions in a quantitative results chapter and one of the easiest places to lose marks, because the decision is visible in your write-up long after the number itself has stopped mattering. What follows is how to find extreme values, how to tell the two kinds apart, what your four legitimate options are, and exactly what to put in the chapter.
What actually counts as an outlier?
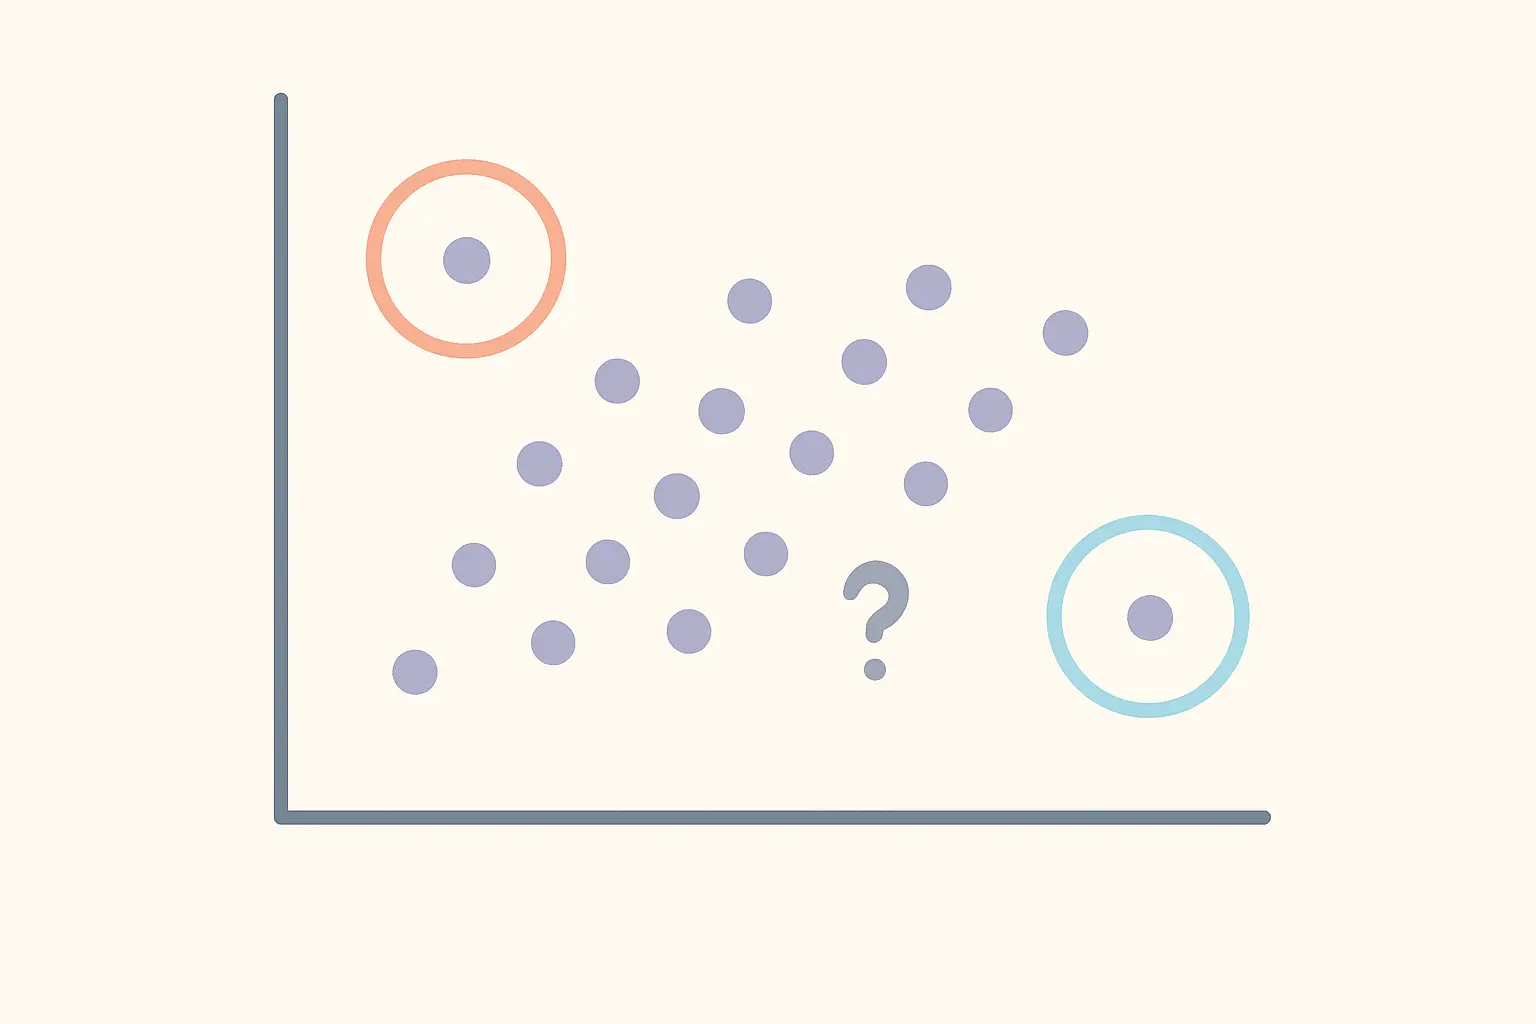
An outlier is an observation that sits far from the rest of your data on one variable, or in an unusual combination across several. It is a description of position, not a verdict on quality.
That distinction is the whole article. Your software can tell you a case is unusual. Only you can tell whether it is unusual because something went wrong or unusual because the world is like that.
How do I find outliers in the first place?
Look before you calculate. A boxplot flags any value more than 1.5 interquartile ranges beyond the nearer quartile, and a histogram shows you whether the extremes are isolated or the tail of a skewed distribution. A scatterplot does the same job for two variables at once, which is why the correlation walkthrough insists you plot before you read the coefficient.
The common numerical rules are standardised scores and the interquartile range. A z-score beyond about ±3.29 marks a case as extreme in a roughly normal distribution; the IQR rule flags anything outside 1.5 times the interquartile range, or 3 times for “extreme” values. Both are conventions, not laws, and both flag more cases as your sample grows.
Two refinements matter once you move past a single variable. A multivariate outlier is unremarkable on every variable separately but implausible in combination — a 19-year-old with 30 years of professional experience — and Mahalanobis distance is the standard way to catch it. And in regression, the question is not distance but influence: Cook’s distance and leverage tell you whether removing one case would visibly move your coefficients. A far-away point that sits on the trend line changes nothing; a moderately unusual point at the end of the range can change everything.
Is it an error or a real value?
This is the only question that licenses deletion, and it is answered from your data collection records, not from the number.
Delete with confidence when the value is impossible or the case does not belong: an age of 219, a seven on a five-point scale, a duplicate submission, a participant outside your stated inclusion criteria, a completion time that shows the questionnaire cannot have been read. These are data-integrity problems and removing them is cleaning, not analysis. If you are working through a survey dataset, the same pass should catch the response-level problems covered in the guide to handling missing data.
Keep the case when the value is merely surprising. Incomes, reaction times, hospital stays, citation counts and social-media followings all have genuinely long tails. The person who scored 98 when everyone else scored between 40 and 70 may be the most informative participant you have. Removing them because the distribution looks tidier afterwards is a decision about your convenience, not about your data.
What are my options if it is a genuine extreme value?
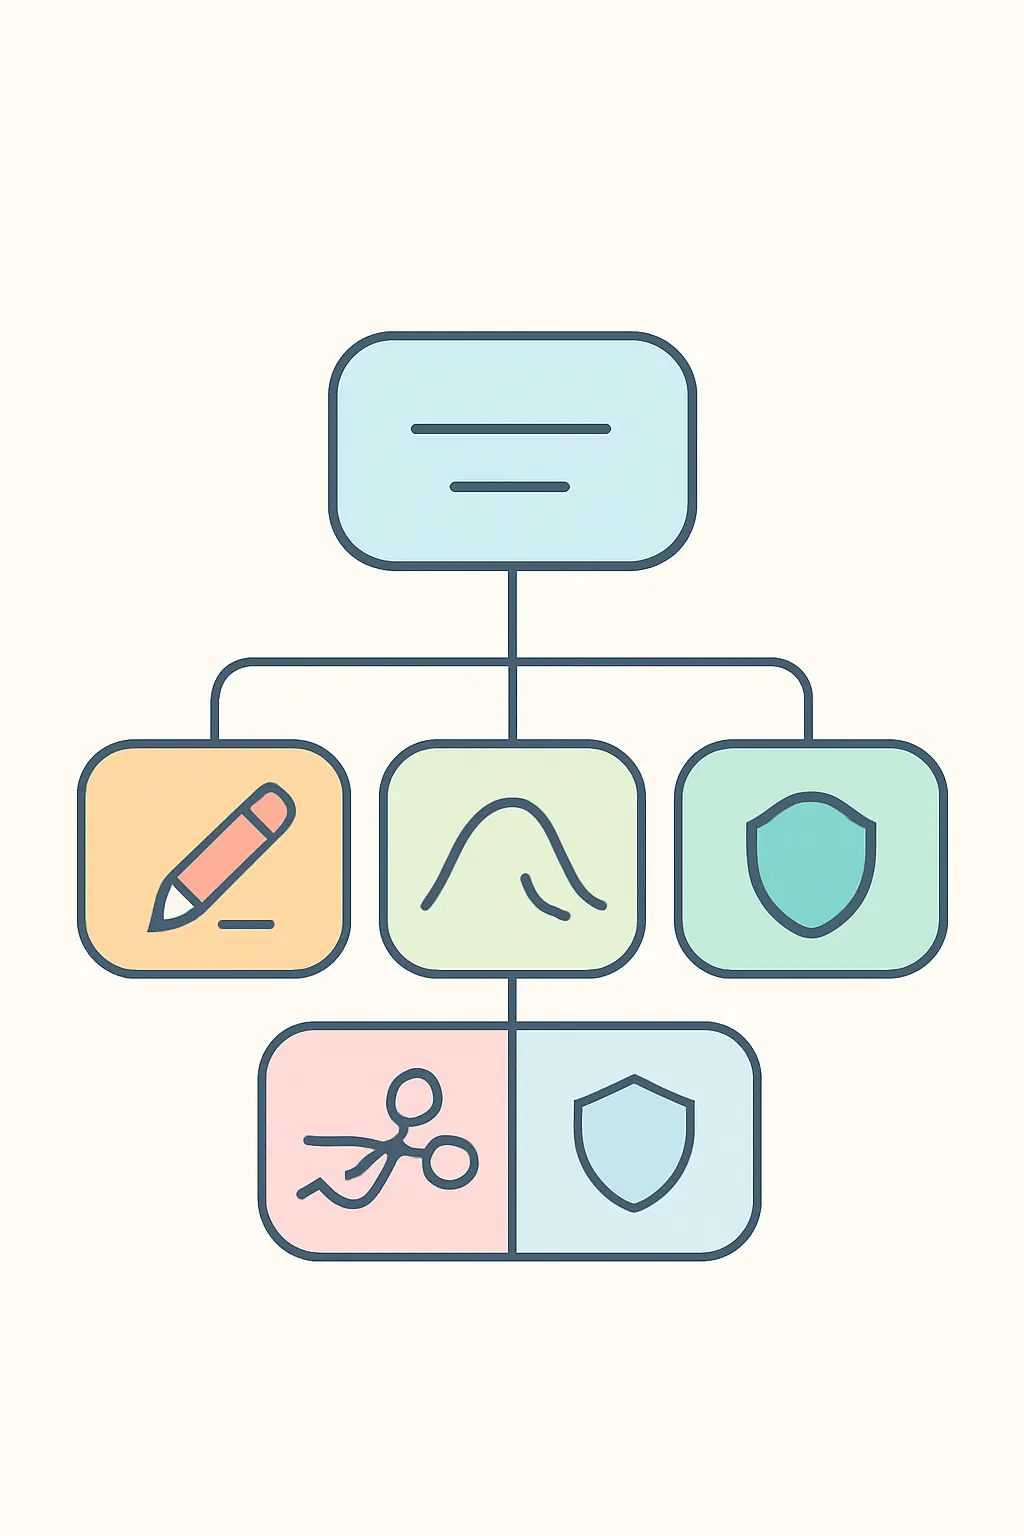
Keep it and say so. Often the correct answer. State that extreme values were inspected and retained because they were plausible, and move on.
Use a method that does not care. Rank-based tests convert your values to positions, so a single extreme score contributes no more than the next one along. This is a strong justification for a non-parametric test and a much better one than a failed normality test — the reasoning is set out in the guide to non-parametric tests. Reporting the median and interquartile range instead of the mean and standard deviation has the same effect on your descriptives.
Reduce its pull without deleting it. Winsorising replaces the most extreme values with the highest value you are willing to treat as ordinary — typically the 5th and 95th percentiles — so the case stays in the analysis with reduced weight. A trimmed mean discards a fixed percentage from each tail. A log or square-root transformation compresses a long right tail, at the cost of changing what your coefficients mean, so anything you report afterwards has to be interpreted on the transformed scale.
Remove it, and prove it did not matter. If you genuinely believe a case distorts the picture, run the analysis with and without it and report both. That is a sensitivity analysis, and it converts a contestable judgement into a transparent one.
What does a sensitivity analysis actually look like?
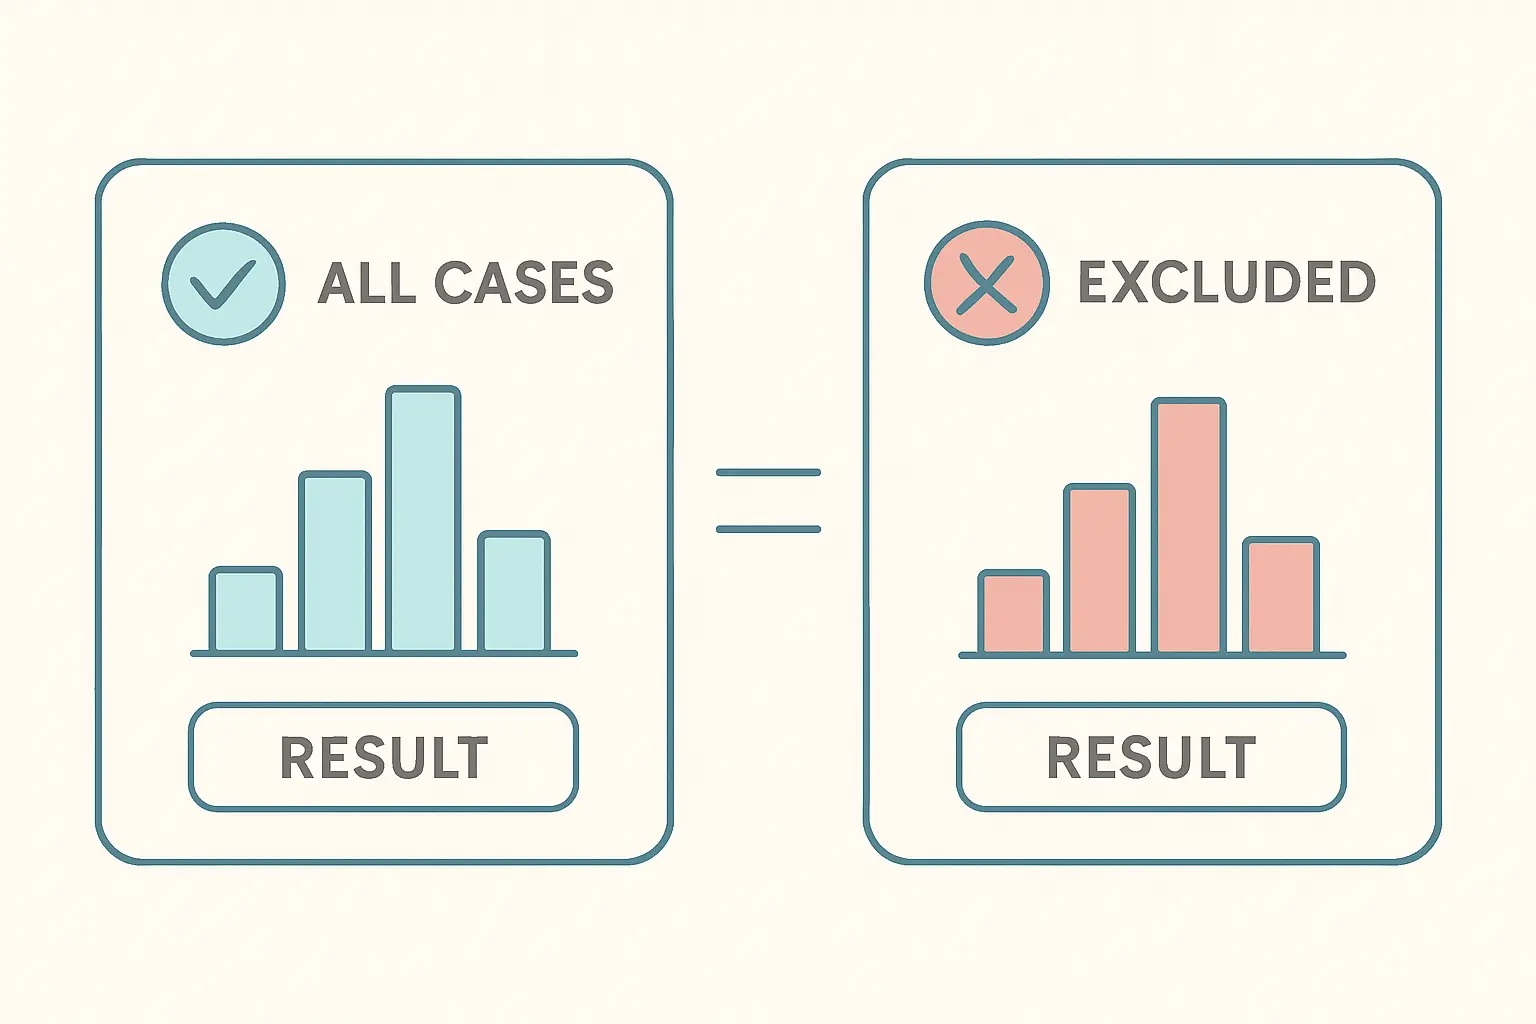
It is a sentence or two, not a second chapter. Run your main analysis on the full dataset, run it again with the case or cases excluded, and report whether the conclusion changes.
If it does not change, you have removed the objection entirely: Three cases exceeded the pre-specified z-score threshold. Excluding them altered the coefficient from .34 to .31 and did not change the direction or significance of the effect, so the full sample is reported.
If it does change, that is a finding rather than an embarrassment. It tells your reader that the result depends on a small number of observations, which is exactly what they need to know, and it belongs in your limitations alongside the effect size and its confidence interval.
When should I decide all this?
Before you look at the outcome. A rule chosen in advance — “cases beyond 3.29 standard deviations will be examined and retained unless the value is impossible” — is a methodological decision. The same rule chosen after seeing that it moves your p-value below .05 is not, and the difference is visible to anyone reading the chapter.
Writing the rule into your analysis plan alongside your other decisions is the cheapest protection available, and it is one of the practices recommended in the guide to reproducible research methodology. It costs one sentence written a month early.
How do I write it up?
A results chapter that handles this well says four things, briefly: how extreme values were identified, how many were found, what was done with them, and what difference it made.
Put the detection method and threshold in your data-screening paragraph, before any inferential results. Give the number of flagged cases as a count, not a percentage of a percentage. State the decision and its justification in one clause. Then, if you excluded anything, give the sensitivity comparison.
Never write that outliers were “removed to improve normality” or “excluded as they were affecting the results”. Both sentences describe the thing markers are trained to look for.
Frequently asked questions
Can I remove outliers to make my results significant?
No. If the exclusion is driven by its effect on the p-value it is not a data-cleaning decision, and reporting the result without disclosing it misrepresents the analysis. A pre-specified rule applied before you look at the outcome, with the analysis reported both ways, is the only defensible route.
How many outliers is too many?
There is no threshold, but a large number is diagnostic rather than a nuisance. If 15 per cent of your cases are flagged, your distribution is skewed rather than contaminated, and the answer is a transformation or a rank-based method, not fifty deletions.
Does a z-score of 3 always mean an outlier?
No. The z-score rule assumes an approximately normal distribution, so on a skewed variable it will flag ordinary values from the long tail. It also depends on sample size: in a sample of 30 a z of 3.29 is barely reachable, while in a sample of 5,000 you would expect several such cases by chance alone.
What is the difference between an outlier and an influential case?
An outlier is far from the other values. An influential case is one whose removal would meaningfully change your model. They often coincide but need not: in multiple regression, Cook’s distance measures influence directly, and it is the more useful number when a model is what you are fitting.
Should I check for outliers on every variable?
Check the variables that enter your analysis, and check them in the combination the analysis uses. Screening twenty demographic variables you never model wastes effort; screening only one variable at a time misses the multivariate cases that Mahalanobis distance is designed to catch.
Do I need to check for outliers before an ANOVA?
Yes, within each group rather than across the whole sample, because a value that is ordinary overall can be extreme inside its own condition. The ANOVA walkthrough covers where this sits in the assumption sequence.
Is an unusual answer on a Likert item an outlier?
Not on a single item — the scale is bounded, so no value can be extreme. A composite score built from several items can have genuine outliers, and a consistent pattern of extreme answers is better treated as a response-style question than a distributional one. See the guide to designing a Likert scale questionnaire.
Does removing outliers affect my sample size calculation?
It affects the sample you actually analysed, which is what your power depends on. If your power analysis called for 128 participants and exclusions leave you with 119, say so and note the consequence rather than quietly reporting the original target.
Should I mention outliers if I did not find any?
Yes, in one clause. “Inspection of boxplots and standardised scores identified no values beyond the pre-specified threshold” tells the marker you checked. Silence reads as an omission, not as an absence.
What do I do if my supervisor tells me to delete them?
Ask what rule the deletion follows and record the answer. If there is a principled one, apply it and state it. If there is not, the sensitivity analysis satisfies both of you: the results are reported with the cases excluded, and the full-sample comparison shows the conclusion does not hinge on the decision.
The short version
Errors get deleted, extremes get respected, and every decision gets written down. If you can name the rule, say when you chose it, and show what difference it made, the question stops being a threat to your results chapter and becomes evidence that you understood your data.
If you are writing that data-screening paragraph now, Tesify can turn your screening notes and output into a properly hedged methods and results passage, with the thresholds, counts and sensitivity comparison in the order a marker expects to read them.
Write your thesis with AI
Structure, draft, cite, and format your thesis faster with Tesify’s AI writing tools, automatic bibliography, and plagiarism checker. Free to start, no credit card required.






Leave a Reply