
How to Build a Data Dictionary for Your Thesis: Variable Documentation, Syntax Files and the Cleaning Log (2026)
Six weeks after you finish your analysis, someone asks what Q7r_new means, why there are 213 rows when you recruited 240, and what the value 99 stands for. If you cannot answer from a document, you will answer from memory — and memory is exactly what an examiner cannot audit. Three artefacts solve this, all of which take minutes to maintain while you work and hours to reconstruct afterwards: a data dictionary, a syntax file, and a cleaning log. Here is what goes in each.
What a data dictionary is (and is not)
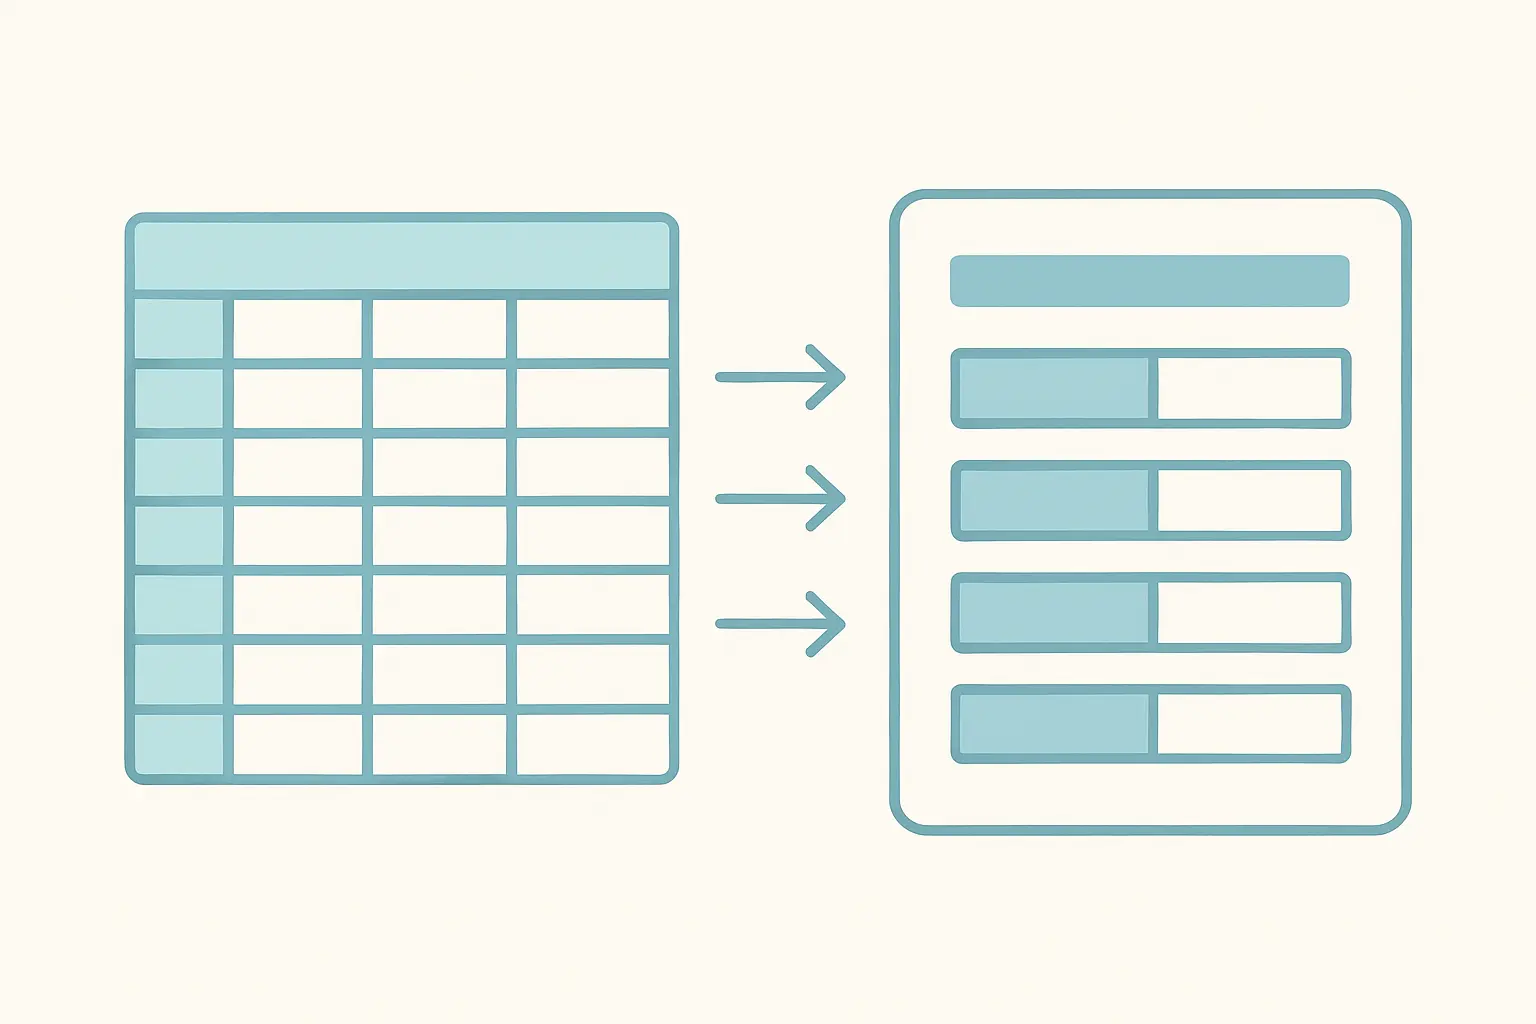
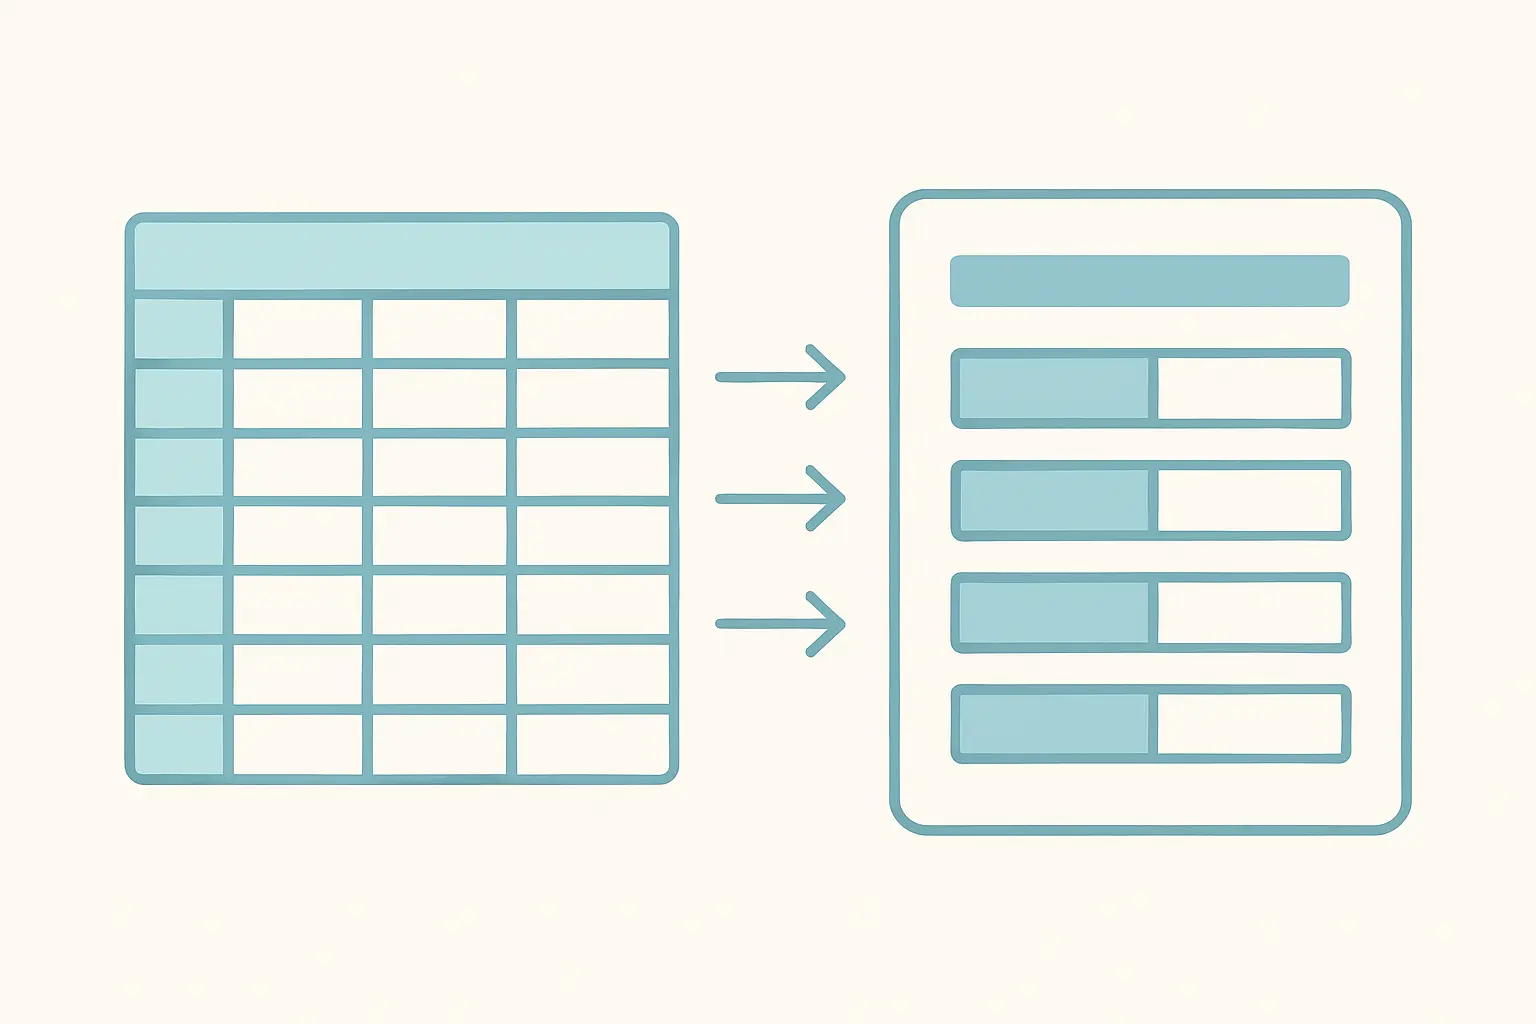
A data dictionary is one row per variable in your dataset, describing what that variable is. It is the document that lets a reader — a supervisor, an examiner, a future you — understand your data file without you standing next to it.
A quick terminology note, because the word collides. In qualitative research, a “codebook” means the list of codes in a thematic analysis. In quantitative data management, “codebook” and “data dictionary” both mean variable documentation. This guide is about the second sense.
The nine fields every entry needs
Build it as a spreadsheet with one row per variable and these columns. Most take seconds to fill in and the whole thing is usually one page for a student dataset.
| Field | What it records | Example |
|---|---|---|
| Variable name | Exactly as it appears in the data file | anx_total |
| Label | Human-readable description | Anxiety scale total score |
| Source | Which question or instrument it came from | Q12-Q18, GAD-7 |
| Type | Numeric, string, date | Numeric |
| Measurement level | Nominal, ordinal, interval or ratio | Interval-treated |
| Values / value labels | What each code means, for categorical variables | 1 = Never … 5 = Always |
| Valid range | Minimum and maximum plausible values | 7–35 |
| Missing codes | Which values mean missing, and which kind | -99 = not answered |
| Derivation | For computed variables, the exact formula | Sum of Q12–Q18 after reversing Q15 |
The derivation column is the one people leave out and the one that matters most. Any variable you created rather than collected — a total score, a recoded group, a median split, a difference score — must record precisely how it was produced, including which items were reversed. This is what makes the difference between an analysis someone can check and one they have to trust.
Variable naming conventions
Decide before data entry, not after. Use short lowercase names with underscores; no spaces, no accented characters, no leading digits, and nothing that clashes with a reserved word in your software. Keep a consistent prefix per scale (anx_1, anx_2, anx_total) so related variables sort together. Mark derived variables visibly — a _r suffix for reversed items, _total for computed scores. And never encode meaning only in the column position, because one inserted column destroys it.
Missing values deserve their own decision
Distinguish the reasons data are absent, because they are not the same thing analytically: not answered, does not apply, withdrew, and failed an attention check are four different states. Give each a distinct code, put those codes outside the valid range so they can never be mistaken for data, and declare them as missing in your software. A stray 99 silently averaged into a five-point scale is one of the most common and most invisible errors in student analysis.
The syntax file: your analysis, written down
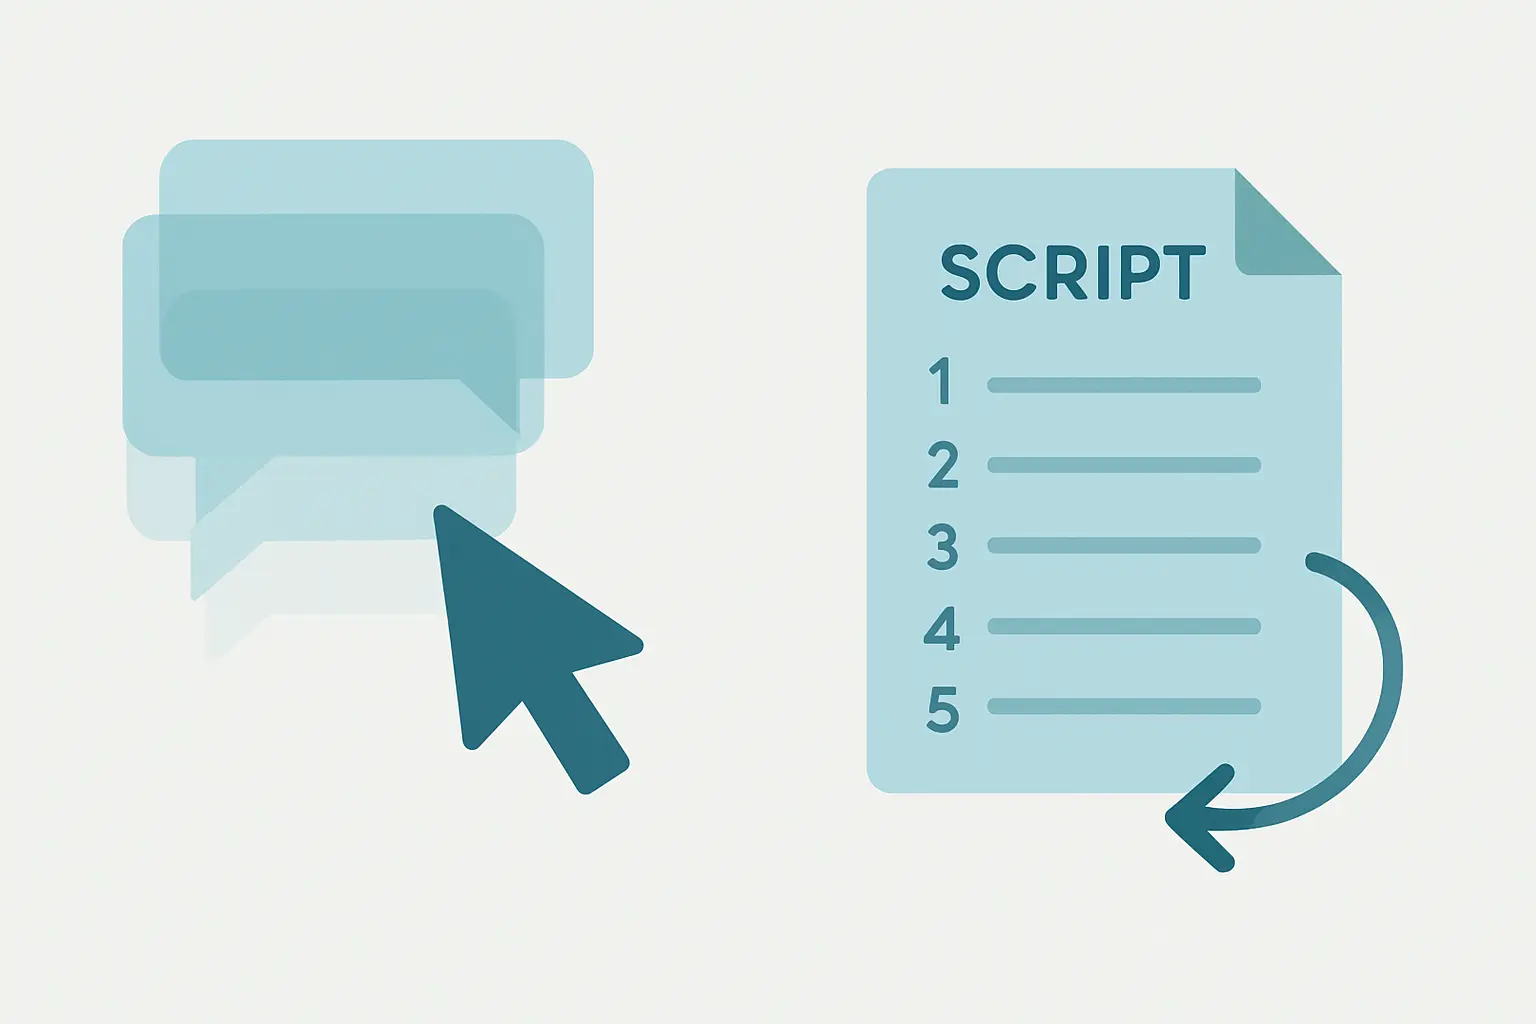
If you work through menus and dialog boxes, your analysis leaves no record. You can see the output but not the steps that produced it, and you cannot re-run it after fixing one data-entry error without repeating every click from memory.
The fix costs nothing. In SPSS, every dialog has a Paste button that writes the equivalent syntax into a syntax file instead of running it directly — click Paste rather than OK, then run from the syntax window. In R, Python, Stata or jamovi you are writing a script already; the discipline is to keep it as one ordered, runnable file rather than a scrollback of fragments.
Structure the file so it runs top to bottom from raw data to final output: import, apply value and missing-value labels, recode and reverse items, compute derived variables, apply exclusions, then run assumption checks and analyses in order. Comment each block with why, not what — the code already says what it does. Save it with your data, and re-run the whole thing from scratch once before you write up. If it does not reproduce your numbers, you have found a problem while there is still time to fix it.
Because the file names your software, remember to cite that software properly in the thesis; our guide to citing datasets, software and code covers the formats.
The cleaning log: raw data is read-only
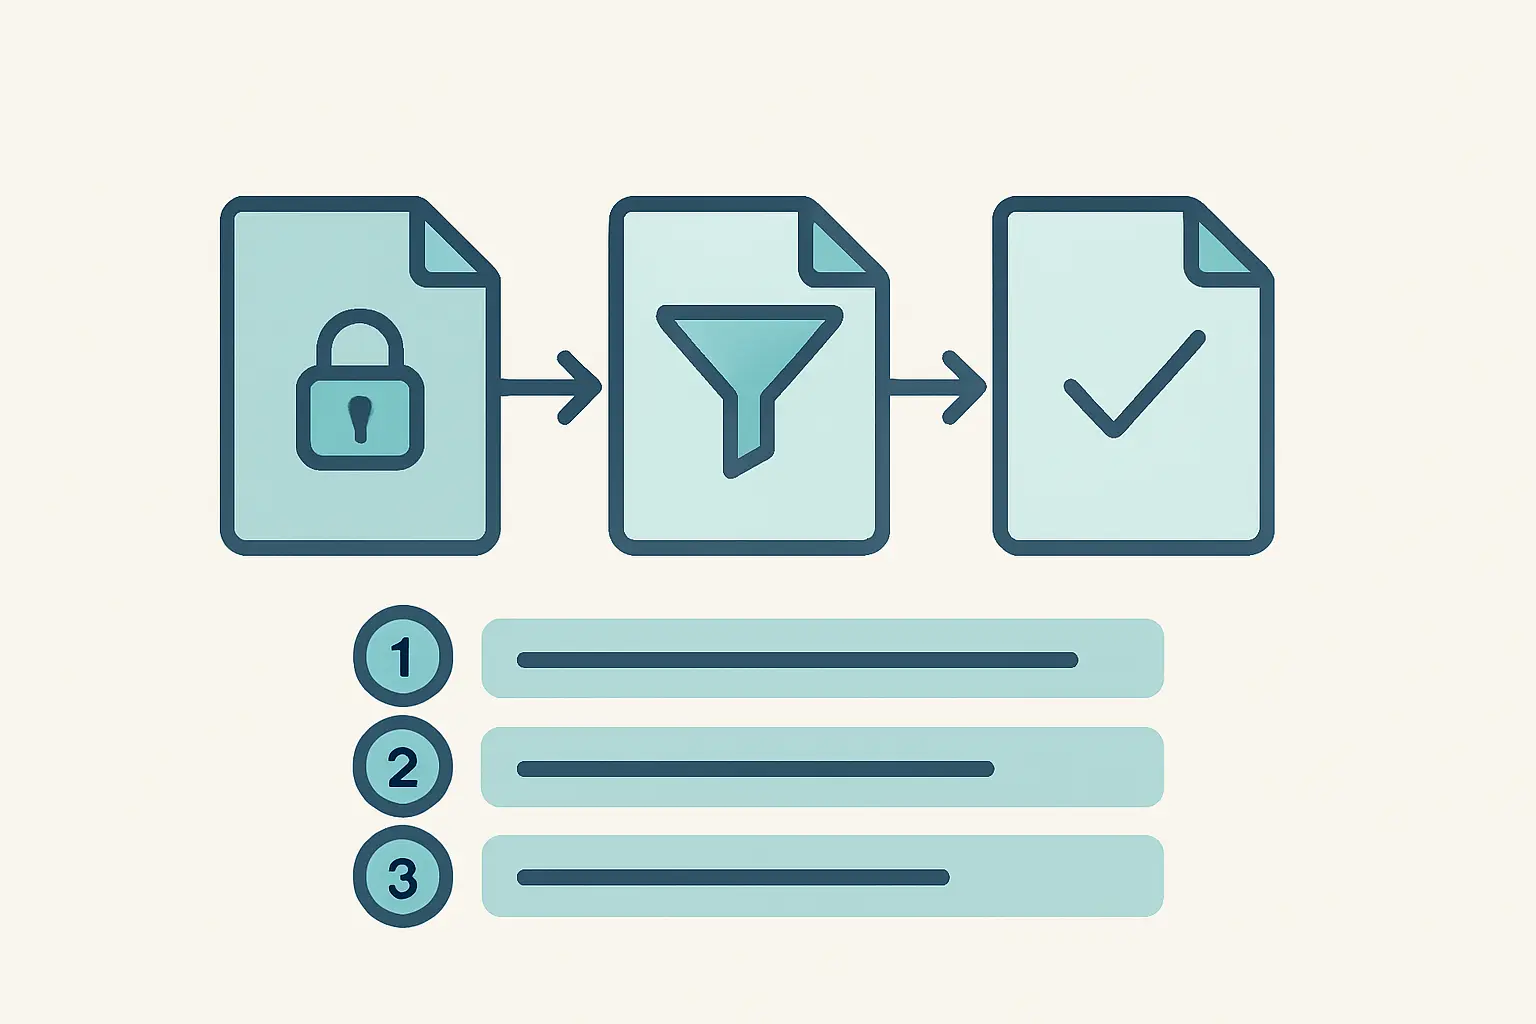
Keep three separate files: the raw export exactly as it came out of your survey platform, never edited; the cleaned analysis dataset produced from it by your syntax; and the log that explains the difference between them. If the second can always be regenerated from the first, you can never lose your data by making a mistake.
The log is a short table, one row per decision: what you did, to how many cases or values, and why. Cases removed for failing an attention check. Duplicate responses from one IP resolved by keeping the first. An out-of-range age of 219 recoded to missing. A participant who withdrew after the deadline. Impossibly fast completions excluded under a rule set in advance.
Two rules make this defensible. Decide your exclusion criteria before you look at the outcome, and record the date you decided. And report your final numbers as a chain — recruited, started, completed, excluded and why, analysed — so the arithmetic is visible. That funnel also answers the recruitment questions raised in our guide to survey response rate statistics, and it forestalls the reporting failures catalogued in our analysis of statistical reporting errors in published research.
A folder structure that survives
Keep it boringly predictable: separate folders for raw data (read-only), cleaned data, syntax, output, and documentation holding your data dictionary and cleaning log. Name files so they sort correctly and date unambiguously — 2026-08-17_analysis_v3.sps rather than final_FINAL_v2b.sps. Use the ISO date order, because it sorts chronologically on its own.
This is the working layer beneath backup and archiving, which are separate problems: our guide to backing up your thesis and the 3-2-1 rule covers keeping the files safe, and FAIR data principles covers depositing them in a repository with a DOI once the work is done.
What goes in the thesis itself
The data dictionary belongs in an appendix, alongside your instrument. The cleaning decisions belong in the methodology as a short prose paragraph with the case numbers, not as a raw table. The syntax file is normally deposited rather than printed, though some departments ask for key excerpts in an appendix — check your handbook, because requirements vary and a missing required appendix costs marks for nothing.
In the methodology, one paragraph does the work: state that data were cleaned according to pre-specified criteria, give the numbers excluded and the reasons, note that reverse-coded items were recoded before scale computation, and say that a data dictionary is provided in the appendix. That paragraph is short, and it pre-empts a whole category of viva questions.
Two places this pays off immediately. Scale construction depends on documented reversal and scoring, as our guide to designing a Likert scale questionnaire sets out. And any analysis that drops or recodes items — exploratory factor analysis being the obvious case — is only defensible if every removal is recorded somewhere an examiner can read.
Frequently asked questions
What is the difference between a data dictionary and a codebook?
In quantitative research they usually mean the same thing: documentation of every variable. Be careful with the word in mixed-methods work, though, because in qualitative analysis a codebook is the list of thematic codes — a completely different object.
Do I really need one for a small dataset?
Yes, and it is cheapest exactly when the dataset is small. Thirty variables take about twenty minutes to document while you remember what they are, and considerably longer to reverse-engineer from a spreadsheet three months later.
When should I create it?
While you are designing the questionnaire, not after collecting data. If you write the dictionary first, it becomes the specification your data entry follows, and inconsistent naming and value coding never happen in the first place.
How should I code missing values?
Use distinct codes outside the valid range — for example -99 for not answered and -98 for not applicable — declare them as missing in your software, and record them in the dictionary. Never leave a blank cell to mean something specific, and never use a plausible value like 0 or 9.
Do I have to use syntax rather than menus?
No rule requires it, but only a script gives you a re-runnable record. In SPSS you get this for free: use Paste instead of OK and the syntax is written for you.
Should the data dictionary go in an appendix?
Usually yes, with the instrument. Check your department’s handbook, since some require it, some allow a repository link, and some have a specific format.
What if I am using a secondary dataset?
It arrives with its own documentation — use it rather than rewriting it, and cite it. You will still need your own dictionary for any variables you derive, and your own cleaning log for any cases you exclude.
Is any of this examinable?
Indirectly, and reliably. Examiners ask how a variable was computed, why the N differs between tables, and what a category means. Every one of those is answered instantly from these three documents and awkwardly from memory.
Document the analysis while you are doing it
Derivations, exclusions and recodes are all decided in the fortnight you spend analysing and all needed in the months you spend writing. Tesify helps you build the methodology and results chapters around those decisions as you make them, so the appendix and the cleaning paragraph already exist when you reach them — 100% written by you.
Write your thesis with AI
Structure, draft, cite, and format your thesis faster with Tesify’s AI writing tools, automatic bibliography, and plagiarism checker. Free to start, no credit card required.






Leave a Reply