

Statistical Reporting Errors in Published Research: What the Data Shows (2026)
Before you worry about whether your own results chapter is good enough, it is worth knowing how the published literature actually performs when its numbers are checked automatically. The answer is sobering, well documented, and directly useful: the specific errors that turn up in peer-reviewed papers are the same ones that turn up in dissertations, and they are all detectable before submission.

Key findings
- Half of published psychology papers using null-hypothesis significance testing contained at least one p value inconsistent with its own test statistic and degrees of freedom (Nuijten et al., 2015).
- One in eight papers contained a grossly inconsistent p value — one large enough that it may have changed the statistical conclusion.
- The analysis covered more than 250,000 p values across eight major psychology journals from 1985 to 2013.
- Gross inconsistencies were more common among results reported as significant than among those reported as non-significant — a pattern the authors note could indicate systematic bias toward significant results.
- Prevalence was stable or declining across the period studied, contrary to earlier findings.
- In preprints across fields, the overall prevalence of incorrectly reported statistics was 9–10%, with no difference between COVID-19 and non-COVID-19 preprints despite the time pressure on the former (van Aert et al., 2023, registered report).
What counts as a “reporting error” here
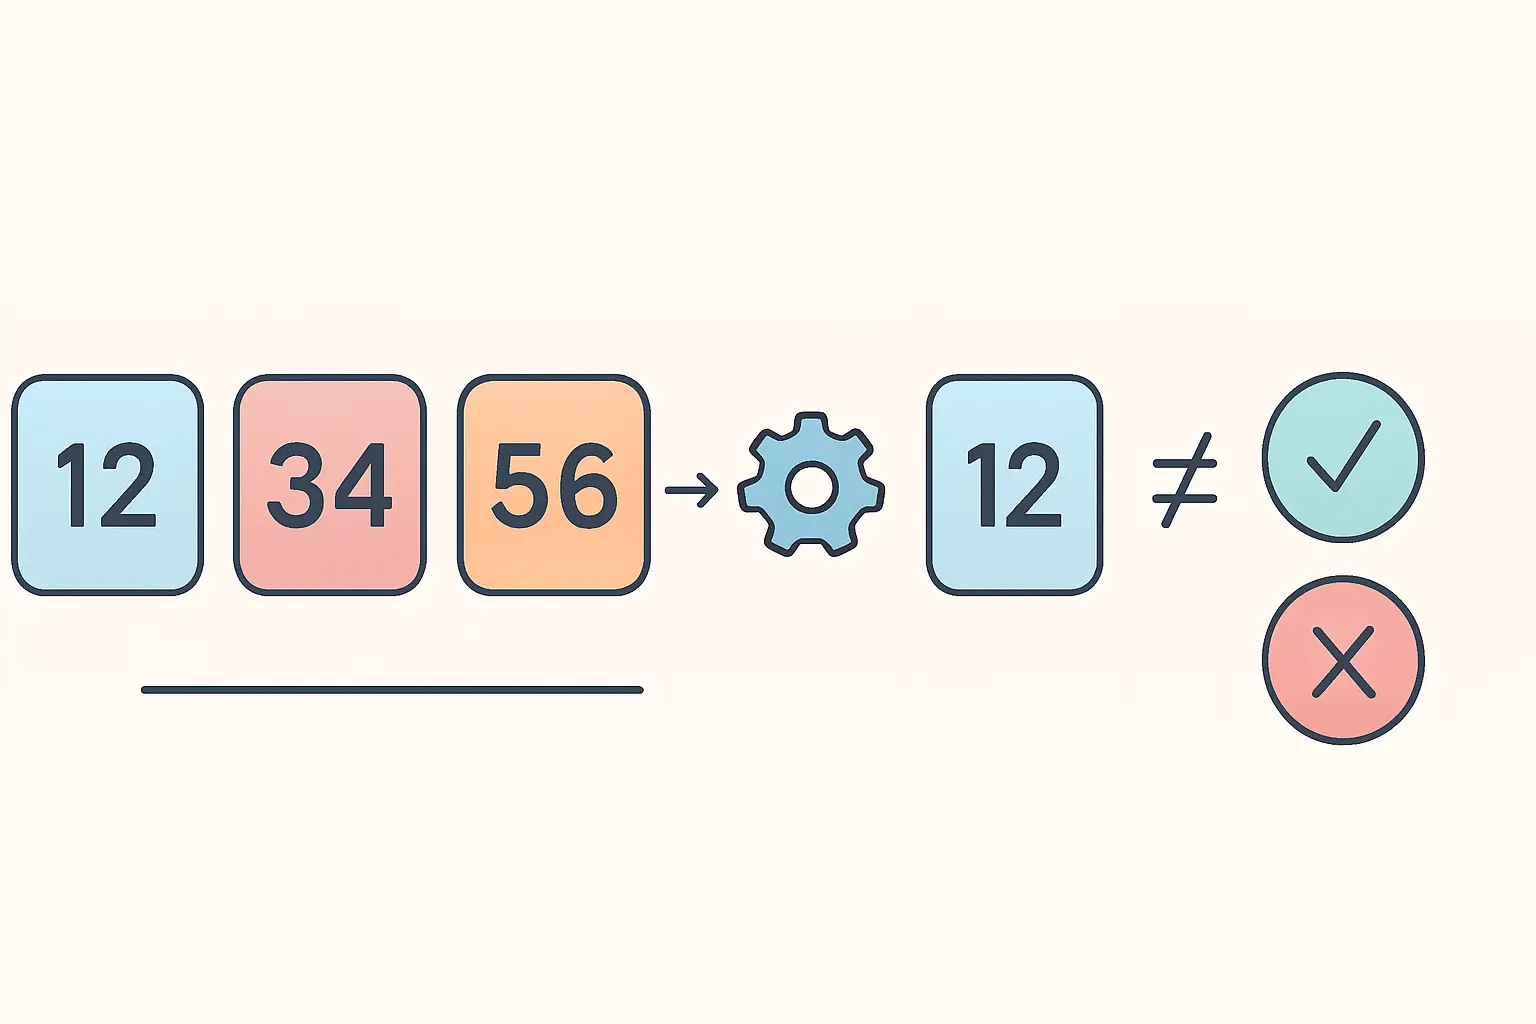
These figures are not about fraud, and they are not judgements about whether a study’s design was sound. They measure something much narrower and much more checkable: internal consistency.
When you report a result in the standard APA form — a test statistic, its degrees of freedom, and a p value — those three numbers are not independent. Given the statistic and the degrees of freedom, the p value is determined. So any reported triplet can be recomputed and compared with what was printed. An inconsistency is a mismatch between the reported p and the recomputed one. A gross inconsistency is a mismatch that crosses the significance threshold — the reported value sits on one side of .05 and the recomputed value on the other.
That distinction is what makes the “one in eight” figure serious. A minor inconsistency is usually a rounding or transcription slip with no bearing on the conclusion. A gross inconsistency means a result described as significant may not be, or vice versa — and every downstream sentence about it may be wrong.
How the checking is done
The prevalence estimates come from statcheck, an R package that parses APA-formatted statistical results out of article text, recomputes each p value from the reported test statistic and degrees of freedom, and flags mismatches. It works because APA reporting is rigidly formatted enough to be machine-readable, which is an underappreciated benefit of the style rules.
Its limits matter for interpreting the numbers honestly. statcheck reads only results written in standard APA inline form, so results presented solely in tables, in non-standard notation, or from tests it does not cover are invisible to it. In the original study it retrieved NHST results from a little over half the articles in the sampled period. It also cannot detect an error where the test statistic itself was computed wrongly — if the analysis was wrong upstream, the reported triplet can be perfectly self-consistent. So these figures are a floor on the error rate, not a ceiling.
| Study | Corpus | Headline figure |
|---|---|---|
| Nuijten, Hartgerink, van Assen, Epskamp & Wicherts (2015), Behavior Research Methods | >250,000 p values, 8 psychology journals, 1985–2013 | ~50% of NHST papers had ≥1 inconsistency; 1 in 8 had a gross inconsistency |
| van Aert, Nuijten, Olsson-Collentine, Stoevenbelt, van den Akker, Klein & Wicherts (2023), Royal Society Open Science | Stratified random sample of COVID-19 preprints vs matched non-COVID preprints | 9–10% of reported statistics incorrect; no COVID vs non-COVID difference |
Note that the two headline numbers are not in conflict — they count different units. The first is the proportion of papers containing at least one bad value; the second is the proportion of individual statistics that are wrong. A paper reporting thirty results has many opportunities to contain one error even when the per-result error rate is low.
Why the errors skew toward significant results
The most consequential finding in the 2015 study is not the headline rate but the asymmetry: gross inconsistencies appeared more often in p values reported as significant than in those reported as non-significant. If reporting errors were purely random slips of transcription, they would be distributed evenly.
The authors are appropriately cautious about the mechanism, noting only that this could indicate a systematic bias in favour of significant results. Several routes produce that pattern without anyone intending to deceive: an author checks a surprising non-significant number more carefully than a confirmatory significant one; a rounding decision goes the convenient way; a value is typed from memory of what it “should” be. Motivated reasoning does not require dishonesty, which is precisely why a mechanical check is worth more than careful reading.
The practical implication for your own work runs in the same direction: you are least likely to re-check the numbers that came out the way you hoped. Check the significant ones hardest.
The errors that show up in dissertations
The published-literature error profile maps almost exactly onto the mistakes markers see in student results chapters. Five recur.
Transcription drift. The analysis is re-run after a data correction, the write-up is updated in some places and not others, and the chapter ends up containing numbers from two different runs. This is the single most common source, and it is why the final analysis should be run once, cleanly, at the end.
Degrees of freedom that do not match the reported N. Often a symptom of listwise deletion silently dropping cases — the df is telling you the true analysed sample, and it does not match the number in your participants section.
Rounding to the wrong precision or the wrong direction. Reporting p = .05 for a value of .054, or writing p = .000, which is never correct — the convention is p < .001.
Copying a result into the abstract or discussion and not updating it when the results chapter changes. Cross-chapter inconsistency is invisible while you edit one section at a time.
Mismatched test statistic and test name — reporting an F alongside a test described in the text as a t-test, or reporting a statistic from an analysis you later replaced, as happens when a design turns out to need a different ANOVA from the one first run.
How to check your own results chapter

Four passes, none of which requires new analysis.
1. Recompute every triplet. For each reported test, check the p against the statistic and degrees of freedom. You do not need statcheck to do this for a dissertation-sized chapter — but running it, or any equivalent recomputation, is exactly the pre-submission use its own authors recommend.
2. Reconcile every df against your stated sample. Where they disagree, find out why before you explain it. Usually the answer is missing data, and it belongs in the write-up.
3. Diff your abstract and discussion against your results chapter. Every number quoted outside the results chapter must match its source exactly. This pass catches more errors than any other because nothing else looks across sections.
4. Check formatting conventions. Exact p values to three decimals, p < .001 rather than .000, italicised statistics, and an effect size beside every test — including the non-significant ones, where our guides to effect sizes and confidence intervals and to reporting a null result explain why the interval carries the meaning.
The general principle, and the one worth internalising: your final analysis should be run once, and every number in the thesis should be traceable to that run. Our guide to writing the results chapter covers the structure that makes this tractable.
Frequently asked questions
What proportion of published papers contain statistical reporting errors?
In the largest analysis of its kind, roughly half of published psychology papers using null-hypothesis significance testing contained at least one p value inconsistent with its reported test statistic and degrees of freedom, and one in eight contained an inconsistency large enough to potentially change the conclusion (Nuijten et al., 2015).
What is a gross inconsistency?
A mismatch between the reported and recomputed p value that crosses the significance threshold — the result is described as significant when recomputation says it is not, or the reverse. Minor inconsistencies are usually harmless rounding; gross ones can invalidate the interpretation.
What is statcheck?
An R package that extracts APA-formatted statistical results from text, recomputes each p value from its test statistic and degrees of freedom, and flags mismatches. It reads only standard APA inline reporting, so results in tables or non-standard notation are not checked.
Are these errors deliberate?
The research does not claim so, and most are consistent with transcription and rounding slips. What it does show is that gross inconsistencies are more common among results reported as significant, which the authors note could indicate a systematic bias in favour of significant findings.
Is this only a psychology problem?
Psychology has been studied most because its APA reporting conventions are machine-readable, not because it is unusually error-prone. A registered report on preprints found an overall incorrect-statistic rate of 9–10% and no difference between COVID-19 and matched non-COVID preprints.
Will my examiner actually check my numbers?
Assume yes for anything that looks unusual. Recomputing a reported p from a test statistic takes seconds, and an inconsistency raises a question about everything else in the chapter — which is a far larger cost than the error itself.
Does p = .000 ever appear correctly?
No. Software rounds very small values to three decimals for display; the correct report is p < .001. Printing .000 asserts a probability of zero, which no test produces.
Make the numbers traceable as you write
Almost every error in this article’s list comes from the same cause: numbers copied by hand between an output window, a results chapter, an abstract and a discussion, then updated in some places and not others. Tesify helps you build the results chapter directly against your analysis, so each figure has one source and one place to change — 100% written by you.
Write your thesis with AI
Structure, draft, cite, and format your thesis faster with Tesify’s AI writing tools, automatic bibliography, and plagiarism checker. Free to start, no credit card required.






Leave a Reply