
Which ANOVA Do You Need? One-Way, Two-Way, Repeated-Measures, Mixed and ANCOVA Compared (2026)
You have your data, you know you are comparing means, and every guide you find explains “the” ANOVA as though there were only one. There are at least five in common thesis use, and picking the wrong one is not a stylistic error — it produces the wrong F, the wrong degrees of freedom, and a results chapter your examiner cannot accept. This comparison sorts them by the two questions that actually decide the answer, and tells you which one your design implies.
The comparison table
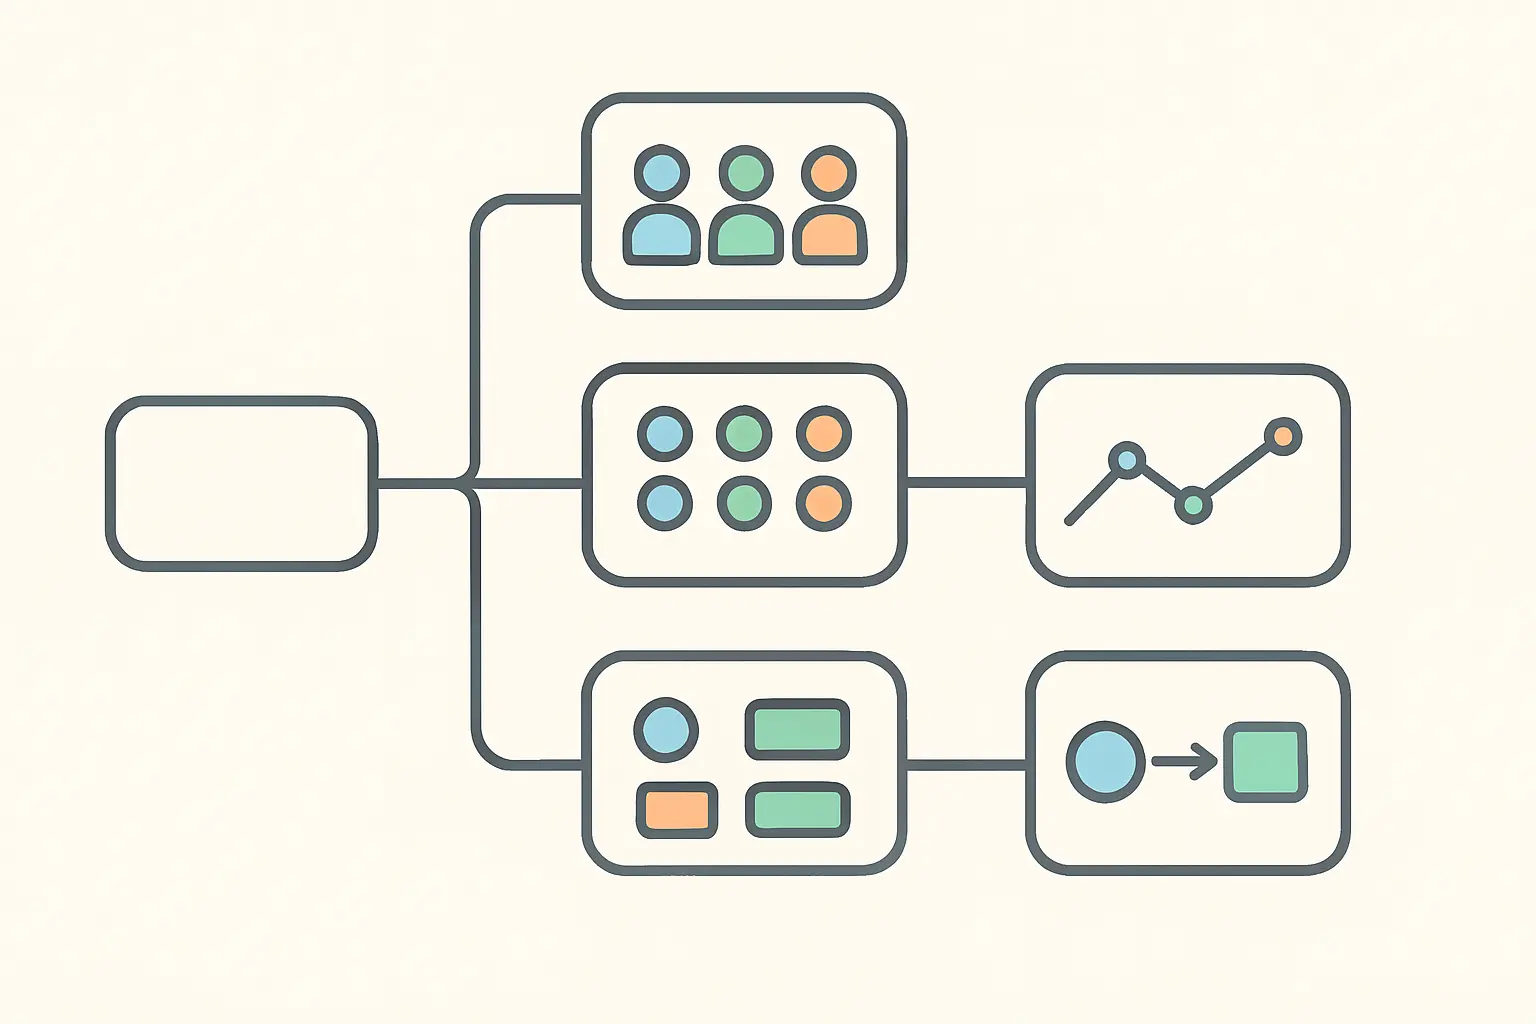
| Design | Independent variables | Are participants repeated? | Answers | Key extra assumption |
|---|---|---|---|---|
| One-way ANOVA | 1 factor, 3+ levels | No — separate groups | Do the group means differ anywhere? | Homogeneity of variance (Levene’s) |
| Two-way (factorial) ANOVA | 2+ factors | No — separate groups | Two main effects plus their interaction | Homogeneity of variance across all cells |
| Repeated-measures ANOVA | 1 factor, 3+ levels | Yes — same people throughout | Does the mean change across conditions or time? | Sphericity (Mauchly’s) |
| Mixed (split-plot) ANOVA | 1+ between, 1+ within | Partly | Does change over time differ between groups? | Sphericity and homogeneity |
| ANCOVA | 1+ factors, plus a covariate | Usually no | Do groups differ after adjusting for the covariate? | Homogeneity of regression slopes |
The two questions that decide it
Almost every wrong choice comes from skipping one of these.
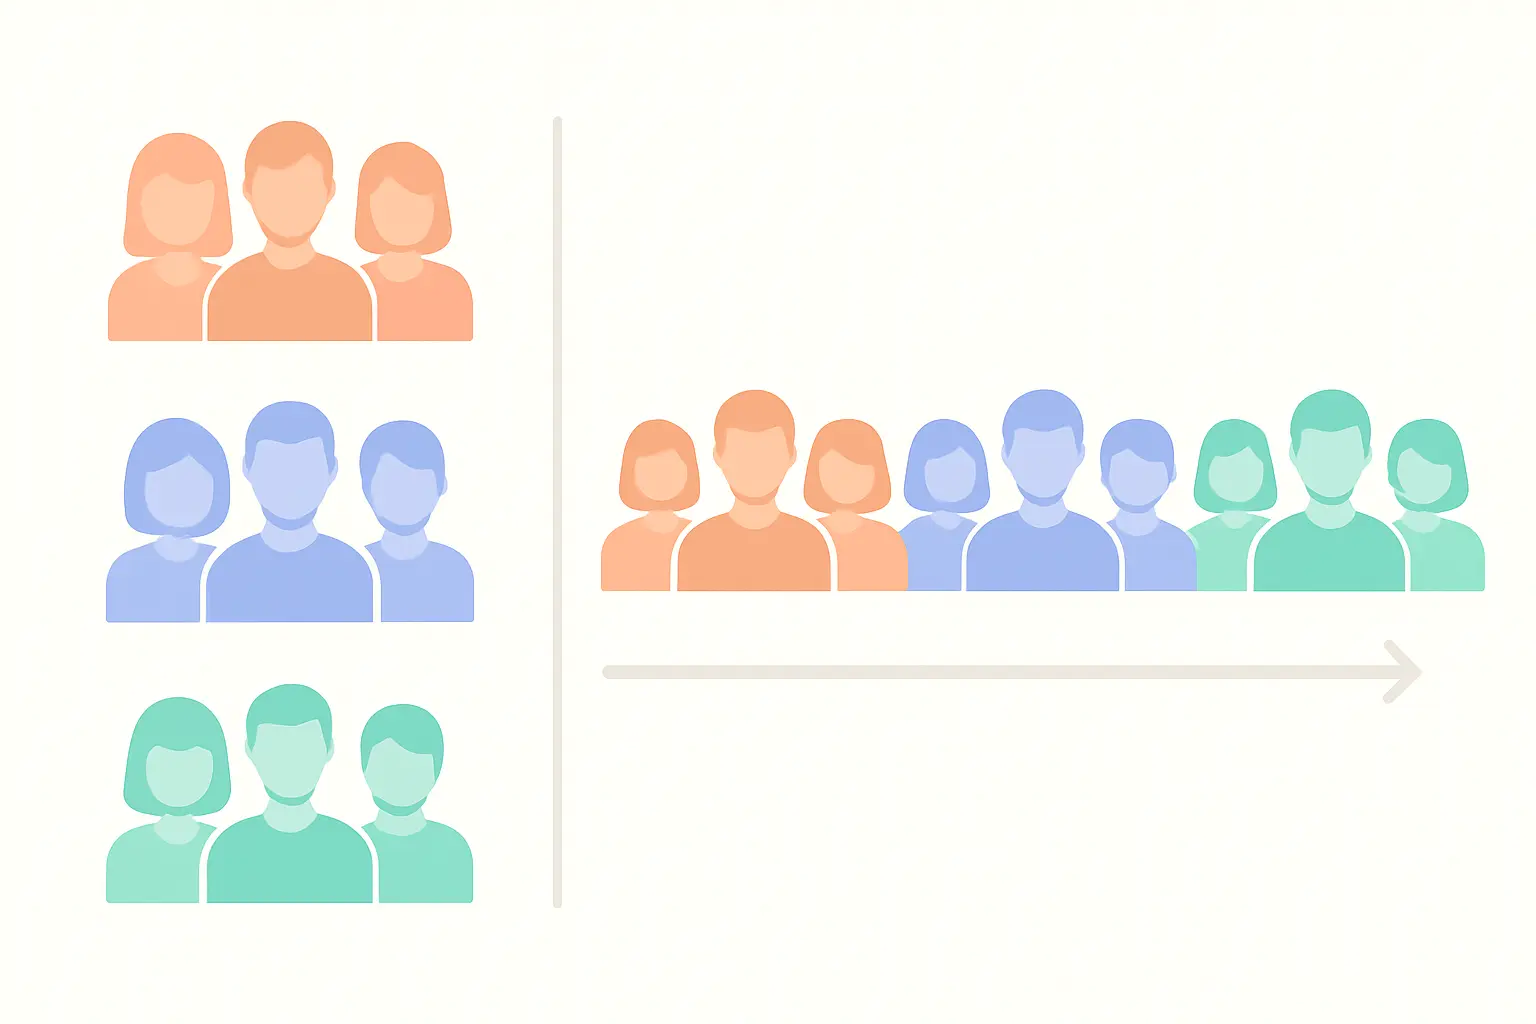
Question 1: are the same participants measured more than once? If each person contributes exactly one score, your design is between-subjects and you want a one-way or two-way ANOVA. If each person is measured under several conditions or at several time points, it is within-subjects and you need a repeated-measures model. The distinction is not cosmetic: repeated measurements on the same person are correlated, and a between-subjects test applied to them treats that shared variance as error, inflating your error term and losing power. If some of your factors are between and some within — three teaching methods, each class tested before and after — you have a mixed design.
Question 2: how many independent variables? One factor gives you a one-way design. Two or more gives you a factorial design, and factorial designs buy you something a pair of one-way ANOVAs cannot: the interaction.
Why the interaction is usually the point
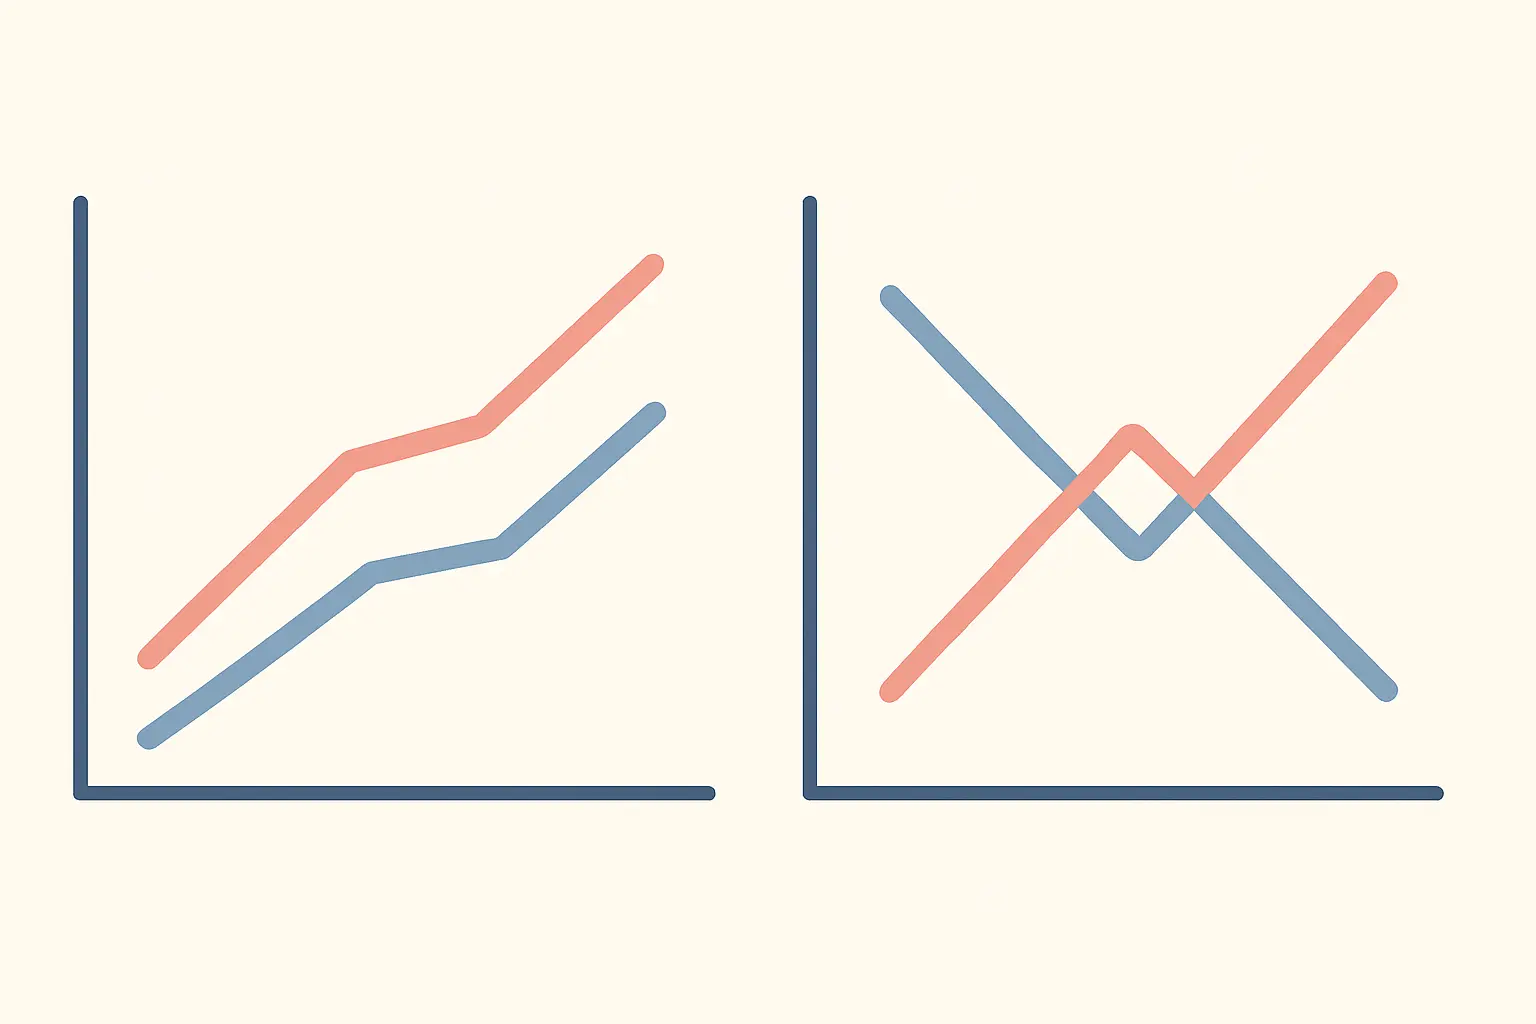
An interaction means the effect of one variable depends on the level of another. A teaching method that works for postgraduates and not for undergraduates is an interaction; a drug that helps men and harms women is an interaction. Plot the cell means and it shows as non-parallel lines.
This matters because running two separate one-way ANOVAs on a two-factor design cannot detect it. You would report that method has an effect and that level has an effect, and miss entirely that the method only works at one level — which is very often the interesting finding and, in an applied thesis, the recommendation. A second reason to prefer the factorial model is statistical: it partitions variance explained by the second factor out of the error term, so the test of the first factor is more sensitive than it would be alone.
The reporting rule follows from the same logic: interpret the interaction first. If it is significant, the main effects are potentially misleading on their own, and your write-up should lead with simple effects — the effect of factor A at each level of factor B — rather than with a main effect that averages across a difference that matters.
When ANCOVA is the right call — and when it is a rescue attempt
ANCOVA adds a continuous covariate and asks whether groups still differ once that covariate is statistically held constant. Used well, it is a precision tool: a pre-test score, baseline anxiety, or prior attainment often explains a large slice of outcome variance, and removing it from the error term makes the group comparison substantially more powerful. In a randomised pre-test/post-test design, using the pre-test as a covariate is generally preferable to analysing change scores.
Used badly, it is an attempt to fix a broken design. If your groups were not randomly assigned and already differ on the covariate, ANCOVA does not “equate” them — it extrapolates to a hypothetical population that does not exist in your data, and the adjusted means can be misleading. It also carries an assumption the others do not: homogeneity of regression slopes, meaning the covariate must relate to the outcome in the same way in every group. You test it by adding a covariate-by-factor interaction term to the model and confirming that it is not significant. If it is significant, ANCOVA is the wrong analysis, because the covariate’s effect differs by group — which is itself a finding worth reporting.
The assumption that changes with the design
All of these models assume approximately normal residuals and independent observations. Two design-specific assumptions do the real work.
Between-subjects designs require homogeneity of variance, checked with Levene’s test. If it fails with unequal group sizes, the standard F is not trustworthy and you move to Welch’s ANOVA, which does not assume equal variances and is available directly in SPSS. Our step-by-step one-way ANOVA guide works through that output in full.
Within-subjects designs require sphericity instead — the variances of the differences between every pair of conditions must be roughly equal. Violating it inflates the Type I error rate badly, and it is checked with Mauchly’s test and corrected with Greenhouse-Geisser or Huynh-Feldt adjustments to the degrees of freedom. The full procedure is in our guide to running a repeated-measures ANOVA in SPSS.
Mixed designs inherit both, which is why they are the most demanding of the five to report properly.
What if no ANOVA fits?
Three common cases fall outside this family entirely.
Only two groups. You do not need an ANOVA at all — a t-test answers the question, and a one-way ANOVA on two groups is algebraically the same test with F = t².
Multiple dependent variables. If you measured several conceptually related outcomes and want to test them jointly rather than run separate ANOVAs with an inflated family-wise error rate, MANOVA is the extension — though running several ANOVAs with a corrected alpha is often clearer to report and easier to defend.
Assumptions badly violated with a small sample. The rank-based alternatives — Kruskal-Wallis for a between-subjects one-way design, Friedman for a within-subjects one — trade some power for far weaker distributional requirements. Our overview of non-parametric tests sets out what you gain and lose. Note that there is no clean non-parametric equivalent of a factorial ANOVA, which is one reason to take the assumption checks seriously in a two-factor design rather than planning to fall back.
The recommendation
Work strictly in this order, and the choice makes itself:
- Count your independent variables. One means one-way; two or more means factorial.
- Ask whether participants repeat. No means between-subjects; yes means repeated-measures; some of each means mixed.
- Ask whether a measured continuous variable would otherwise be noise. If yes and it was measured before the intervention, add it as a covariate — ANCOVA.
- Check the assumption that belongs to that design — Levene’s for between, Mauchly’s for within — and take the correction rather than ignoring it.
- Report the interaction before the main effects in any factorial design.
The single most common error in student theses is running a one-way ANOVA on a repeated-measures design because the data were entered in long format and the one-way dialog accepted them. SPSS will not warn you. The design determines the test; the software only executes it.
Sample size: the hidden cost of adding a factor
The comparison above is about validity, but there is a feasibility dimension that decides many designs before the statistics do. Adding a second factor multiplies your cells, not your groups. Three teaching methods becomes a nine-cell design once you cross it with three year groups, and a rule of thumb of 20 participants per cell turns a 60-person study into a 180-person one. Students routinely design elegant factorial studies and then discover in week nine that they cannot recruit for them.
This is one of the strongest practical arguments for a within-subjects or mixed design where the research question permits it. Because each participant serves as their own control, a repeated-measures design detects the same effect with markedly fewer people than the equivalent between-subjects design. The trade-offs are order effects and practice effects, which you manage by counterbalancing the sequence of conditions — and which you should say you counterbalanced, because an examiner will look for it. Where the factor is something a person cannot plausibly experience twice, such as a first-time diagnosis or a one-off training programme, the between-subjects design is forced and the recruitment target is simply the cost of the question.
Getting the design named right in the write-up
Whichever model you run, the methods chapter has to say four things unambiguously: how many independent variables there are, how many levels each has, whether each is between- or within-subjects, and what the dependent variable is. The conventional shorthand does all four at once — “a 3 × 2 mixed factorial design, with teaching method (three levels) as a between-subjects factor and time (pre-test, post-test) as a within-subjects factor”. A reader who sees that sentence knows exactly which test should follow, and an inconsistency between that sentence and your output is one of the easiest errors for an examiner to spot.
Frequently asked questions
What is the difference between a one-way and a two-way ANOVA?
A one-way ANOVA has a single independent variable; a two-way has two, and additionally tests whether they interact — whether the effect of one depends on the level of the other. That interaction cannot be recovered by running two one-way tests.
When should I use a repeated-measures ANOVA instead of a one-way ANOVA?
Whenever the same participants are measured under every condition or at every time point. Treating correlated within-person measurements as independent groups inflates the error term and costs you power.
What is a mixed ANOVA?
A design with at least one between-subjects factor and at least one within-subjects factor — for example two treatment groups each measured at three time points. Its most useful output is the group-by-time interaction, which tests whether the groups changed differently.
Is ANCOVA better than ANOVA?
Not better, different. ANCOVA is more powerful when a genuine covariate explains outcome variance and was measured before the intervention. It is inappropriate as a way to compensate for non-random group differences, and it requires homogeneity of regression slopes.
Can I use ANOVA with only two groups?
You can, and it gives the same answer as an independent-samples t-test, since F = t² with two groups. The t-test is the conventional report.
What do I do if Mauchly’s test of sphericity is significant?
Do not abandon the analysis. Report the Greenhouse-Geisser corrected degrees of freedom and F, which is the standard remedy, and state that the correction was applied and why.
Do I need a post-hoc test after every ANOVA?
Only after a significant effect of a factor with three or more levels, and only if you did not specify planned contrasts in advance. A significant F tells you the means differ somewhere; the post-hoc test tells you where.
Get the design named correctly in your methods chapter
Whichever model you run, your methodology chapter has to state the design, the factors, whether each is between or within subjects, and the assumption checks you performed. Tesify helps you write that chapter as you make the decisions, so the analysis you report is the analysis you actually ran — 100% written by you.
Write your thesis with AI
Structure, draft, cite, and format your thesis faster with Tesify’s AI writing tools, automatic bibliography, and plagiarism checker. Free to start, no credit card required.






Leave a Reply