
Population, Sample and Sampling for a Public Health Thesis (2026): Inclusion Criteria, Design Choice and Sample Size
Every public health dissertation runs into the same wall sooner or later: you have a research question, you have a rough idea of a design, and then a supervisor asks, “who exactly are you going to study, how many of them, and how will you get to them?” Sampling in public health is not a footnote — it is the decision that determines whether your prevalence estimate means anything, whether your association could plausibly be causal, and whether an ethics committee will sign off on your access plan at all. This guide works through population definition, the sampling designs epidemiology actually uses, sample-size reasoning for a prevalence or comparative study, and the access problem that trips up more MPH and undergraduate public health projects than any statistical error does.
1. Target Population vs Study Population
Public health research questions are almost always framed at the level of a population you cannot possibly reach in full — “adults with type 2 diabetes in England,” “adolescents exposed to wildfire smoke in the western United States,” “community health workers delivering maternal-health interventions in sub-Saharan Africa.” This is your target population: the group your research question is ultimately about, and the group to which you would like your findings to generalise.
Your study population (sometimes called the source population or accessible population) is the narrower, practically reachable subset you can actually sample from — patients registered at three GP practices in one city, students enrolled at a single university, service users at a named community clinic in a defined period. The gap between target and study population is not a flaw to hide; it is a fact to state plainly and then discuss honestly when you interpret your results. A dissertation that studies “diabetes management among patients at two East London GP practices” is not entitled to claim its findings describe “diabetes management in England” — but it is entitled to argue, carefully, why the East London context is or is not likely to differ from the wider target population on the dimensions that matter to your question.
2. Writing Inclusion and Exclusion Criteria
Inclusion and exclusion criteria are the operational definition of your study population — the rules a reader could apply themselves to decide whether any given individual, record or site belongs in your study. Examiners look for criteria that are specific enough to be applied consistently and justified against your research question, not just copied from a template.
| Criterion type | Worked example (illustrative) | Why it is there |
|---|---|---|
| Demographic inclusion | Adults 18–64, registered at the partner clinic 12+ months | Bounds the age range and ensures a full year of records |
| Clinical/exposure inclusion | Confirmed diagnosis code in the electronic record | Replaces self-report with a verifiable field |
| Exclusion — data quality | Records with 20%+ missing data on the primary outcome | Prevents near-empty records distorting estimates |
| Exclusion — capacity/consent | Unable to consent, no legal representative available | Protects those who cannot consent for themselves |
Write your criteria before you approach a single participant or pull a single record, and file them alongside your ethics application. Retrofitting criteria after you see who responded is a well-recognised form of selection bias, and examiners who spot post-hoc criteria will ask about it directly in the viva or in written feedback.
3. Probability Sampling Designs in Public Health

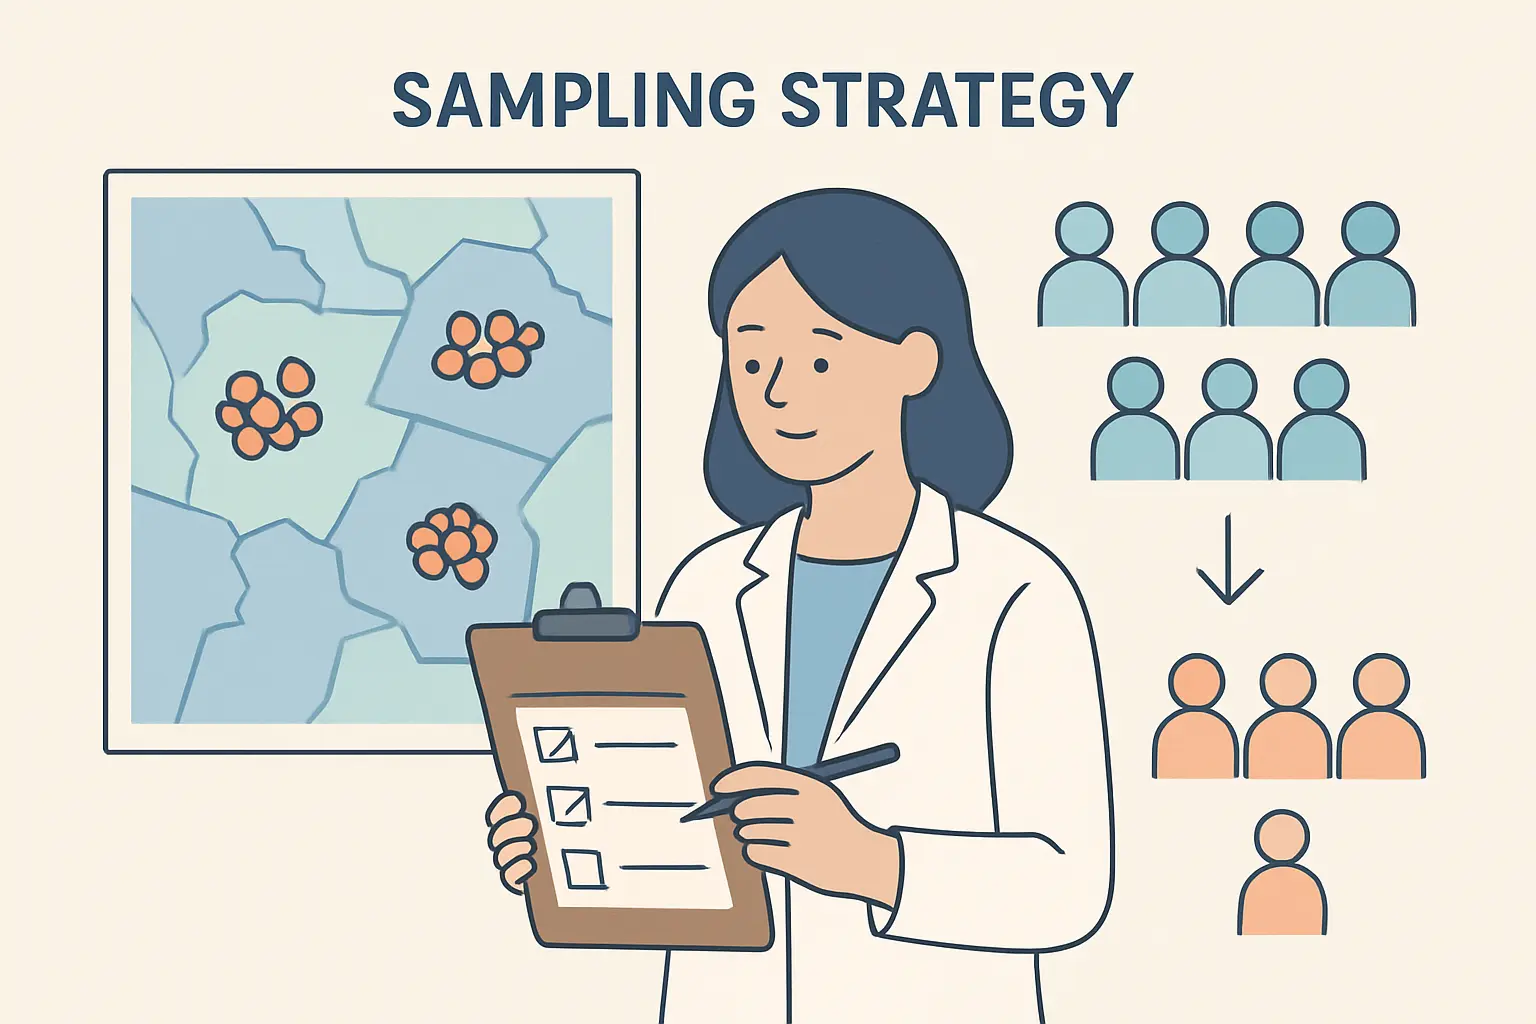
Probability sampling gives every unit in your sampling frame a known, non-zero chance of selection, which is what allows you to generalise a sample statistic to the wider population with a calculable margin of error. Four designs dominate public health research:
- Simple random sampling — every unit in a complete list (a clinic register, a school roll) has an equal chance of selection. Rarely feasible at full scale in student research since a complete frame is uncommon, but it is the benchmark every other method is judged against.
- Stratified random sampling — the population is divided into strata (age band, sex, deprivation quintile, disease stage) and units are randomly sampled within each. The design of choice when a policy-relevant subgroup is too small to appear reliably by chance.
- Cluster sampling — naturally occurring groups (GP practices, schools, wards) are randomly selected first, then individuals within them are sampled or fully enumerated. The practical default when no individual-level frame exists but a list of sites does — at the cost of a design effect that inflates variance.
- Multistage sampling — clusters, then sub-units, then individuals are sampled in nested stages. National health surveys almost always use this design because no single national list of individuals exists.
4. Non-Probability Sampling and When It Is Defensible
Most master’s-level public health dissertations that involve primary data collection use non-probability sampling, and this is not automatically a weakness — it is a design choice that must be argued for and its limits acknowledged.
- Convenience sampling — recruiting whoever is accessible: patients attending a clinic in a given window, students on a campus. Fast and low-cost, but carries real risk of systematic bias.
- Purposive sampling — participants are selected for specific characteristics relevant to the question (frontline community health workers, people who disengaged from a programme). The standard approach for qualitative work aiming at depth over population-level estimation.
- Snowball sampling — existing participants refer others from their networks. Often the only workable route into stigmatised or otherwise hard-to-enumerate populations.
- Quota sampling — recruitment targets are set for specific subgroups without random selection within them. A practical compromise when a full frame is unavailable but proportional representation still matters.
Whichever non-probability method you use, name it explicitly, state why a probability design was not feasible within your time and resource constraints, and discuss the direction — not just the existence — of the bias it most likely introduces. For the fuller mechanics of building and piloting a data-collection instrument around whichever sampling strategy you choose, see our guide on designing a survey for academic research.
5. A Real-World Model: How NHANES Samples the US Population
The US National Health and Nutrition Examination Survey (NHANES), run by the CDC’s National Center for Health Statistics, is a useful reference point because its sampling choices are public and well documented. NHANES uses a complex probability sample designed to represent the health and nutritional status of the entire US population, and it deliberately oversamples specific groups — including children and adolescents, adults 60 and older, and African American, Asian and Hispanic individuals — so estimates for these groups stay statistically reliable despite being a smaller share of the population. Around 5,000 people are examined each year across US communities as part of the ongoing survey.
The lesson for a thesis-scale project is not that you need NHANES’s budget — you do not — but that oversampling a subgroup you care about, rather than assuming it will appear in adequate numbers by chance, is a legitimate, well-precedented design choice. If your question centres on a minority within your accessible population, state that you deliberately oversampled it and explain how you accounted for that analytically.
6. Calculating Sample Size for a Prevalence or Comparative Study

“How many participants do I need?” has a different answer depending on whether you are estimating a single prevalence or comparing two groups.
For a prevalence estimate
The standard formula for a simple random sample estimating a single proportion is n = Z²p(1−p)/e², where Z is the value for your confidence level (1.96 for 95%), p is your expected prevalence (0.5 if unknown, which maximises n), and e is your margin of error. Illustratively: a prevalence around 20% (p = 0.20), 95% confidence and a 5-point margin of error gives n = 1.96² × 0.20 × 0.80 / 0.05² ≈ 246 under simple random sampling. For a cluster sample, multiply by a design effect (commonly 1.5–2.5 for community cluster surveys) to account for the reduced efficiency of clustering.
For a comparison between two groups
If your question is a difference or association — exposed versus unexposed, intervention versus control — sample size depends on statistical power, not the prevalence formula above: an expected effect size, α = 0.05, and a target power of 0.80, calculated in dedicated software rather than by hand. Our companion guide to sample size and power analysis with G*Power works through the inputs and worked test-by-test examples that transfer directly to an epidemiological comparison.
Whichever formula applies, add 10–20% to your calculated minimum to allow for non-response, missing data or attrition, and state that buffer explicitly in your methodology chapter rather than quietly padding the number.
7. Access, Gatekeepers and the Ethics Timeline
The single most common reason a public health dissertation’s sampling plan collapses mid-project is not a statistical error — it is that access to the sampling frame was never confirmed before the ethics application went in. A clinic manager, a school head, or a national data custodian is a gatekeeper whose agreement your plan depends on, and securing it can take weeks or months and still fall through.
Build your timeline backwards from your data-collection window: confirm in writing that a gatekeeper will grant access to the register, roll or patient list you plan to sample from; identify whether the data requires a formal data-sharing agreement (common with NHS-derived or restricted-access national datasets); and only then finalise the ethics submission, since most committees expect evidence of access alongside the sampling plan itself. If your design instead uses secondary, already-collected data such as a national survey’s public-use file, the access question shifts to a data-use agreement rather than a gatekeeper relationship — that route is covered in our complete MPH dissertation guide.
8. Reporting Your Sample in the Methodology Chapter
The STROBE reporting guideline for observational studies — endorsed by the EQUATOR Network and expected by most public health examiners and journals — requires cohort, case-control and cross-sectional studies to describe their eligibility criteria and the sources and methods used to select participants, not merely a final sample size. Structure your sub-section so a reader could replicate your selection process: populations, criteria in full, the design and why it beat the alternatives, the sample-size calculation with every input named, and the achieved sample compared honestly against your target. See our guides on writing a research methodology chapter and, for any shortfall, writing a research limitations section.
A smaller, single-site sample also points naturally toward a future-research recommendation. Our guide on writing recommendations for future research works through that translation with public-health-specific examples.
Frequently Asked Questions
What is the difference between a target population and a study population in public health research?
The target population is the full group your question is ultimately about — for example, all adults with type 2 diabetes in a country. The study population is the narrower group you actually sample from, such as patients registered at two named clinics. State both explicitly, and do not claim generalisability the study population cannot support.
Can I use convenience sampling for a public health dissertation?
Yes — convenience sampling is common in student public health projects because a full sampling frame is rarely available in a one-year programme. It is defensible as long as you name it explicitly, justify why probability sampling was not feasible, and discuss the likely direction of the bias it introduces.
How do I calculate sample size for a prevalence study?
Use n = Z²p(1−p)/e², where Z corresponds to your confidence level, p is your expected prevalence, and e is your acceptable margin of error. If your design is a cluster sample, multiply the result by a design effect of roughly 1.5–2.5, then add 10–20% for non-response.
Why does NHANES oversample certain groups, and should my thesis do the same?
NHANES oversamples groups such as children and adolescents, adults 60 and older, and specific racial and ethnic groups so their estimates stay statistically reliable. If your question centres on a minority subgroup, deliberately oversampling it — and stating this explicitly — is a legitimate design choice at any scale.
What should I do if I cannot get gatekeeper access to my planned sampling frame?
Confirm access in writing before finalising your ethics submission, since most committees expect evidence of access alongside the sampling plan. If access falls through, discuss a fallback with your supervisor early — secondary-data analysis, a narrower single-site study, or a different accessible population — rather than discovering the problem mid-application.
Write Your Sampling Section With Confidence
Once your population, criteria and sample-size calculation are settled, translating them into a methodology chapter examiners find convincing is a writing problem as much as a statistical one. Tesify is an AI-powered academic writing tool built specifically for thesis and dissertation students — it helps you structure and draft your sampling, ethics and analysis sections with the clarity a public health examiner expects.
Write your thesis with AI
Structure, draft, cite, and format your thesis faster with Tesify’s AI writing tools, automatic bibliography, and plagiarism checker. Free to start, no credit card required.




Leave a Reply