
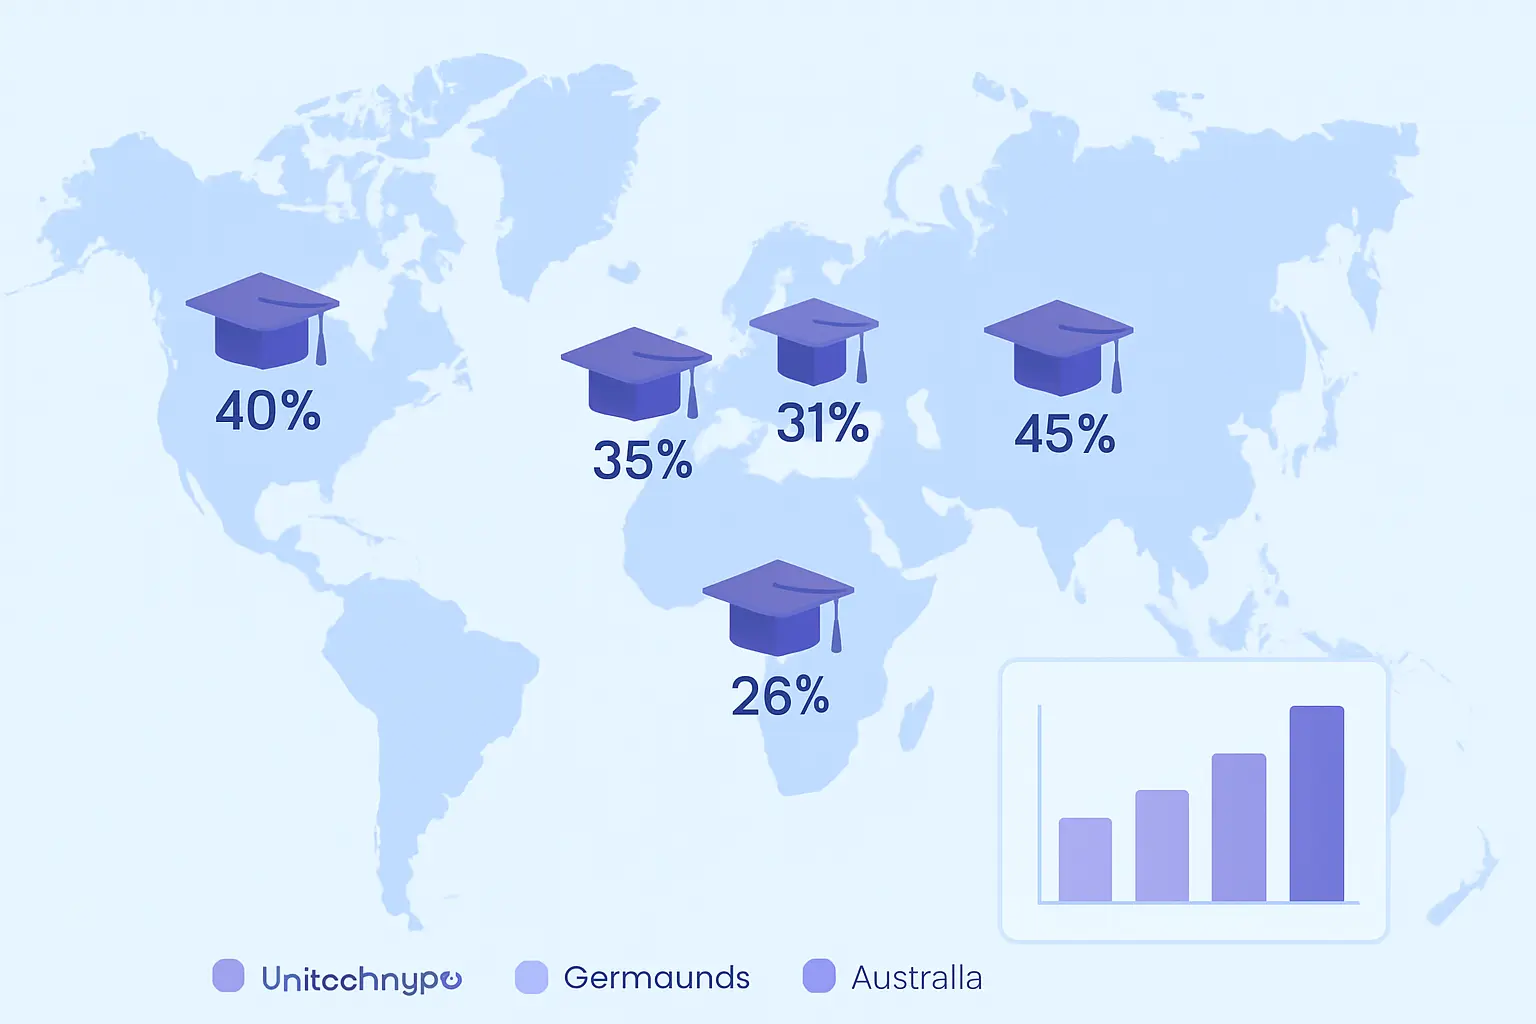
PhD Completion and Dropout Rate Statistics by Country 2026
Only 56.6% of doctoral candidates in the United States complete their degree within ten years of enrollment — a figure that has remained stubbornly consistent across more than a decade of data collected by the Council of Graduate Schools. PhD completion and dropout rate statistics tell a more nuanced story depending on which country, discipline, and student demographic you examine, but the global picture is consistent: a substantial minority of students who begin a doctorate never finish one.
The reasons are structural and personal: underfunded programs, strained supervisor relationships, mental health pressures, and the rising cost of living in university cities all extract a toll. The decision to leave is rarely impulsive — most attrition accumulates across years of incremental disengagement, often during the dissertation-writing phase when formal supervision contacts are fewest and the path forward is least clear. Understanding where, why, and how quickly doctoral candidates exit programs is essential for universities designing retention interventions and for prospective PhD students benchmarking their own risk.
This data roundup compiles verified PhD completion and dropout rate statistics for the United States, United Kingdom, Australia, the Netherlands, Germany, and other jurisdictions — including country-level breakdowns, field-of-study data, time-to-degree figures, demographic patterns, and the structural trends reshaping doctoral education heading into 2026.
Key Findings at a Glance
The table below summarises headline PhD completion and dropout statistics across major research systems. All figures are drawn from national survey agencies, government education authorities, or peer-reviewed longitudinal studies and are current to the most recent available data cycle.
| Country | Completion Rate | Timeframe / Notes | Source |
|---|---|---|---|
| United States | ~57% | Within 10 years of enrollment | Council of Graduate Schools |
| United Kingdom | ~80.5% (avg. dropout ~19.5%) | Avg. across 14 institutions | Discover PhDs FOI data |
| Australia | ~80% | Within normative enrollment period | Dept. of Education national cohort data |
| Netherlands | ~50% (dropout ~49.9%) | Longitudinal cohort | Groenvynck, Vandevelde & Rossem (2013) |
| Germany | Varies significantly by field | Higher in humanities vs. STEM | Higher Education / Springer (2021) |
United States: CGS and NSF Data
The most comprehensive longitudinal dataset on US doctoral attrition comes from the Council of Graduate Schools (CGS) PhD Completion Project, which tracked approximately 49,000 students across 330 doctoral programs at 30 research universities. The headline finding: 57% of doctoral candidates completed their degree within ten years of beginning the program. The remaining 43% either left before completion or remained enrolled beyond the ten-year window without graduating.
Within that overall figure, timing matters considerably. CGS data show that approximately 20% of all enrolled candidates had completed by year seven, with a further increment completing between years eight and ten. This means a meaningful share of apparent “non-completers” at the five- or six-year mark do eventually finish, particularly in disciplines with longer normative timelines. The highest concentration of attrition occurs in the first two years of a program — before students have passed candidacy examinations — and again during the post-coursework dissertation phase, when structured support contracts.
The NSF’s Survey of Earned Doctorates (SED), an annual census of all individuals receiving a research doctorate from an accredited US institution, recorded 58,131 new research doctorates granted in 2024, with 98.5% classified as PhDs. This represents a long-run upward trend in absolute doctoral output even as per-cohort completion rates have remained relatively flat, indicating that growth in enrollments is outpacing any improvements in institutional retention.
For individual institutions, variation is wide. Stanford University reports a median completion time of 5.7 years with approximately 63% of candidates graduating within six years. Cornell’s median time to degree is 5.8 years, with 81% completing within a seven-to-twelve year window. Arizona State University reports approximately 85% of PhD students finishing within six years — an above-average figure attributed to structured doctoral support programs. These institutional benchmarks make clear that program structure and investment in doctoral support have measurable effects on completion outcomes.
Completion outcomes have direct consequences for academic career trajectories. The academic job market statistics for 2026 show how the narrow tenure-track pipeline interacts with rising doctoral output: more PhDs are competing for fewer permanent positions, a dynamic that increasingly influences students’ willingness to persist through a lengthy doctoral program.
United Kingdom: Dropout Rates by Institution
UK data on doctoral dropout is more fragmented than US data — there is no single national longitudinal cohort study equivalent to the CGS project — but freedom of information requests submitted by Palatinate and Discover PhDs reveal both the averages and the institutional range. Across 14 UK universities, the average PhD failure rate (students who began but did not complete) was 19.5%, implying a mean completion rate of approximately 80.5%. Institutional variation is wide: dropout rates across 10 universities tracked by Palatinate spanned 7% to 35%, with some programs — particularly in education and social sciences — reporting rates at the upper end of that range.
One specific benchmark: the University of Durham’s Education doctorate program had a reported dropout rate of 45% based on FOI data — one of the highest recorded figures for a major UK institution. Conversely, STEM-heavy programs at research-intensive universities typically reported dropout rates below 15%. These extremes bracket the wide disciplinary variation that national averages inevitably obscure.
For the share of candidates who reach the final viva examination in the UK, outright failure is rare. Approximately 3.3% of candidates fail their viva — meaning they receive neither a PhD nor a conditional pass — with the large majority of viva failures resulting in the award of an MPhil rather than complete non-completion, according to Discover PhDs data. Most viva “failures” are more accurately characterised as referrals to revise and resubmit within a defined period.
HESA’s most recent student statistics release recorded 28,245 postgraduate research qualifications awarded in 2022/23, a 13% recovery from the pandemic trough of 25,100 in 2020/21. International students accounted for 45% of postgraduate research qualifications — a share that has grown steadily and has direct implications for the language, financial, and cultural support structures universities need to maintain for doctoral retention. International PhD students navigating post-study visa options in the UK can find relevant guidance in the UK Graduate Route Visa 2026 guide.
When doctoral candidates do encounter delays and need formal additional time, the data on how universities respond is relevant: the thesis extension and deferral statistics document how frequently extensions are approved in the UK and Australia, and under what conditions, providing a practical counterpart to the dropout figures.
Australia: Outperforming Global Averages
Australian doctoral education has achieved completion rates markedly above the US benchmark and above most European systems. Analysis of national completion data from the Australian Department of Education spanning 2005–2018 — published in the Australian Universities’ Review — found that close to 80% of PhD candidates complete within the normative time period: roughly twice the ten-year completion rate recorded in the Council of Graduate Schools US study.
This performance differential reflects several structural factors working in combination. Admission selectivity is higher relative to program capacity; mandatory candidature milestone reviews at six months, eighteen months, and annually thereafter create structured accountability; the stipend model (Research Training Program stipends covering fees and living costs for full-time domestic candidates) reduces financial attrition; and a culture of supervisor accountability is enforced through institutional performance monitoring and workload modeling. Australian universities introduced these stronger completion norms from the late 2000s, and longitudinal data across the 2005–2018 window shows steady improvement in on-time completion following those structural interventions.
Field-level variation persists. PhD students in the Science faculties exhibit an apparent attrition rate of around 33% within five years of commencement at some Australian institutions — meaning roughly one-third did not complete within that window, though many subsequently completed on extended timelines. Education doctorates show a similar pattern. Nonetheless, even these below-average Australian discipline clusters compare favorably to equivalent discipline completion rates in the US and the Netherlands.
European Countries: Netherlands and Germany
European doctoral education is structurally diverse — ranging from the traditional German individual apprenticeship model, in which doctoral candidates work closely with a single professor, to structured graduate schools common in the Netherlands and Scandinavia — and direct cross-country comparison is complicated by differences in how attrition is defined and measured.
The Netherlands provides some of the richest European data on doctoral attrition. A longitudinal study by Groenvynck, Vandevelde, and Rossem (2013) found a dropout rate of approximately 49.9% across Dutch university doctoral programs — a rate comparable to the US but significantly higher than Australia and the UK average. Critically, discipline-level variation in the Netherlands is extreme: the dropout rate in law approaches 40%, roughly twice the rate in economics, agriculture, engineering, and the natural sciences, where approximately 20% of candidates leave without completing their degree. A separate analysis reported by TU Delft’s student newspaper confirmed that roughly one in four employed PhD candidates at Dutch universities quits before finishing the dissertation. These field differentials align with broader international evidence that natural-science programs — with their structured lab environments, daily supervisor integration, and defined experimental milestones — retain students more effectively than programs in which doctoral candidates work more independently on text-based projects.
In Germany, a 2021 event history analysis published in Higher Education (Springer) found that dropout probability is significantly shaped by discipline and funding source. Students in the humanities and social sciences are less likely to complete their PhD than those in natural sciences and medicine. Women show a somewhat higher probability of dropout than men in German data — a finding that echoes, though does not fully replicate, the demographic patterns observed in the US. Scholarship availability is a significant protective factor: funded doctoral students in Germany have markedly better completion outcomes than their unfunded peers, pointing to financial precarity as a mechanism of attrition rather than merely a correlate of lower-completion disciplines.
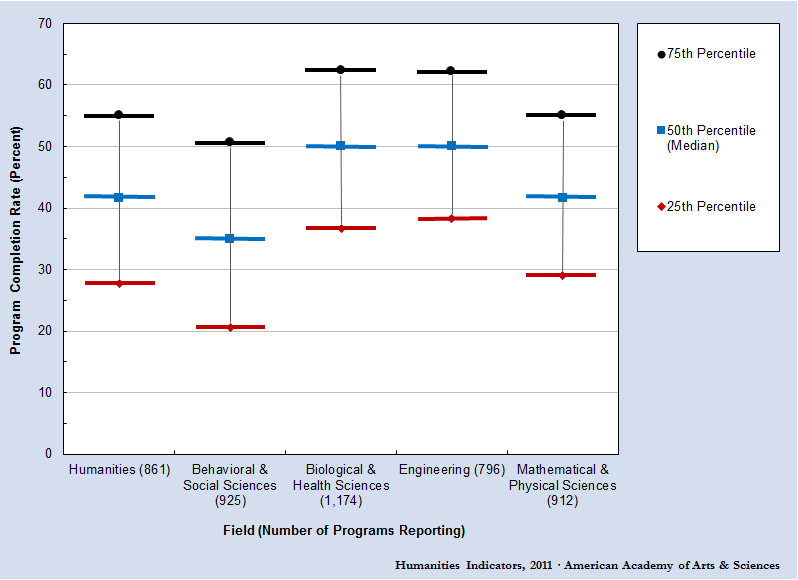
Completion Rates by Field of Study
Across all countries with available data, the directional pattern is consistent: STEM fields and medicine record higher PhD completion rates than humanities, education, and social sciences. The magnitude of the gap varies by national system, but the direction does not.
| Field | Approx. Completion Rate | Notes |
|---|---|---|
| Natural Sciences | ~62% | Dutch longitudinal study (Groenvynck et al., 2013) |
| Engineering | Above average; lowest dropout | Fastest median time-to-degree (~5.3 yr, US NSF SED) |
| Social Sciences | ~29% | Dutch longitudinal study; broader cross-national estimates: 40–55% |
| Humanities | Below average | Longest median time-to-degree (7+ yr, US NSF SED) |
| Law | ~60% (dropout ~40%) | Dutch data; highest-attrition field in that dataset |
| Education | Below average | Durham Education PhD dropout: 45% (UK FOI, Palatinate) |
The social sciences figure from the Groenvynck study (29.4% completion within the observation window) warrants contextual reading: it reflects completion within a specific timeframe and should not be taken as the absolute share of social science doctoral students who never complete. Cross-national studies using broader definitions typically place social science completion in the 40–55% range over extended windows. The directional finding nonetheless holds: text-based, independently structured doctoral programs — where candidates have fewer daily touchpoints with their supervisor and fewer defined experimental milestones — retain students less effectively than lab-based, milestoned programs.
Psychology PhDs, which fall within the broader social sciences grouping but carry specific disciplinary demands around empirical research design and ethical approval timelines, face a particularly complex completion challenge. The psychology dissertation guide covers the chapter structure and methodological expectations that shape timelines in this field.
The field-level completion gap also shows up in earnings outcomes after the doctorate. The PhD salary by field data demonstrates that the disciplines with highest attrition — humanities and social sciences — are often also those with the largest gap between the opportunity cost of a PhD and post-PhD earnings, a dynamic that may itself influence mid-program completion decisions.
Median Time to Degree by Discipline
Time-to-degree is one of the strongest predictors of eventual completion: the longer a doctoral candidate remains enrolled without reaching candidacy or filing the dissertation, the greater the cumulative risk of attrition through financial pressure, competing life obligations, and loss of momentum. NSF Survey of Earned Doctorates data for US doctorate recipients provides the most granular annual time-to-degree figures by field.
| Field | Median Registered Time (years) | Median Total Grad School Time (years) |
|---|---|---|
| Engineering | ~5.3 | ~5.7 |
| Life Sciences | ~5.7 | ~6.3 |
| Social Sciences | ~6.5 | ~8.2 |
| Humanities | 7+ | 9+ |
| All fields (overall) | 5.7 | 7.2 |
The “registered” column counts only time enrolled in the doctoral program; “total graduate school” includes any master’s-level work completed at the same institution before or alongside the doctorate. The humanities total-graduate-school median of nine or more years represents a substantial life and financial commitment, and the personal opportunity cost of this timeline is a well-documented factor in humanities attrition — particularly for candidates who entered the program with academic career ambitions they have since revised downward.
Students who encounter delays and require formal additional time are a distinct subset from those who leave entirely. See the thesis extension statistics for data on how often extensions are approved in the UK and Australia, and how institutional policies on deadline extensions interact with ultimate completion outcomes.
Why PhD Students Drop Out: Attrition Drivers
Doctoral attrition is rarely caused by a single event. Exit surveys and qualitative studies consistently identify a cluster of overlapping pressures that compound over time. The following are the factors most consistently documented in peer-reviewed literature and institutional surveys:
- Supervisor relationship breakdown: The supervisor–supervisee relationship is cited in multiple studies as the single most important institutional factor in doctoral persistence. Poor communication, misaligned expectations, infrequent meetings, and limited mentorship each independently predict attrition. Research published in Studies in Higher Education (Vol. 48, No. 6, 2023) on supervisor support and doctoral persistence found that inadequate supervisor support is among the strongest predictors of intended withdrawal, with effects that differ by gender. For data on how often PhD students and advisors actually meet across disciplines and countries, see the supervisor meeting frequency statistics.
- Mental health deterioration: Surveys consistently document elevated rates of anxiety and depression among doctoral candidates relative to comparably educated non-PhD populations. The isolation of dissertation-stage work, compounded by financial strain and career uncertainty, is a direct mechanism — not merely a correlate — of attrition. Institutional responses, including counselling access and peer community programs, have expanded since 2020. See the PhD student mental health data for detailed prevalence figures and intervention evidence.
- Financial pressure: Inadequate stipend relative to local cost of living is a documented predictor of dropout, particularly in expensive research cities and in disciplines where unfunded doctoral places are common. Funded doctoral students in Germany have markedly better completion outcomes than unfunded peers in the same programs. The PhD stipend and cost-of-living gap statistics quantify how far stipends stretch across different national contexts.
- Career uncertainty and academic job market disillusionment: A growing proportion of doctoral candidates begin programs with academic career ambitions and encounter the reality of a severely constrained tenure-track market. Disillusionment — particularly once students enter the postdoc awareness phase — can accelerate the decision to leave before completion, especially when the alternative career value of a PhD in that discipline is perceived as low. The academic job market statistics show how narrow the tenure-track pipeline has become across disciplines.
- Isolation and lack of program structure: Programs that leave candidates unsupported through the dissertation writing phase — once coursework ends and before the final submission — record higher attrition than those with formal milestone structures, peer cohort mechanisms, and regular progress checkpoints. The transition from structured coursework to independent dissertation work is the period in which attrition risk is highest in text-heavy disciplines.
Demographic Disparities in PhD Completion
Completion rates are not evenly distributed across demographic groups in any national system with available data. In the United States, CGS data show that Black doctoral candidates have a ten-year completion rate of approximately 47% — the lowest of any racial group tracked, and approximately 10 percentage points below the overall US average of 57%. The CGS PhD Completion Project found that women and underrepresented minorities as a combined category face lower completion rates and higher late-completion rates compared to white male peers, a pattern that held across the diverse institutional and disciplinary contexts represented in the study’s 330 programs.
Age at entry is another consistently documented predictor. Research across multiple national contexts finds that candidates entering doctoral programs before age 26 have significantly higher completion probabilities. Dutch longitudinal data (Groenvynck et al.) found that younger entrants have approximately 50% higher likelihood of completion relative to those entering after age 30 — a finding attributed partly to fewer competing personal and professional obligations at entry, and partly to the compounding effect of financial strain and career opportunity cost over a longer enrollment period for older students who may have delayed family and mortgage decisions.
Part-time enrollment is also consistently associated with higher attrition. Students studying part-time — more common in professional doctorates, education, and some social science disciplines — typically face competing work demands that reduce the sustained focus available for dissertation work, even when total program length is formally extended to accommodate the mode of study. Part-time doctoral candidates in the UK recorded lower on-time completion rates in HESA data tracking qualification outputs relative to part-time entrant cohorts.
Trends Shaping Doctoral Education in 2026
Several structural trends are reshaping PhD completion patterns. Graduate school enrollment in the United States continued rising through 2024 according to NSF SED data, meaning more absolute completers even as per-cohort rates remain flat — a sign that expansion has outrun retention infrastructure in many programs. International doctoral enrollment has grown significantly in the UK and Australia, and the specific support needs of international candidates — who may face language barriers, visa uncertainty, and family separation — are increasingly a focus of doctoral retention strategy.
Mental health provision has expanded at many research universities following pandemic-era recognition of doctoral wellbeing as a retention variable rather than a pastoral afterthought. Formal co-supervision requirements, structured candidature milestone reviews, and peer community programs have been introduced at institutions that previously left dissertation-stage candidates largely unsupported through the critical post-coursework period.
AI tools have entered the dissertation workflow in measurable ways. A growing number of doctoral candidates are using AI writing assistants not to replace scholarly contribution but to manage the structural and administrative burden of large-document writing — organising literature, drafting section outlines, checking reference formatting, and running originality self-checks. As use cases multiply, questions about what is and is not academically permissible are high on both student and institutional agendas. Tesify covers exactly this question for thesis candidates in what AI use is allowed in thesis writing. For broader adoption data, the AI in academic writing statistics document rapid uptake across all doctoral disciplines and regions.
Stipend reform is also in motion. Several US graduate schools and UK Research and Innovation (UKRI) raised doctoral stipends in 2024 and 2025 in response to cost-of-living advocacy, though gaps between stipend levels and urban living costs remain substantial in research-intensive cities. Whether these increases measurably improve completion rates will become visible in cohort-level data over the coming three to five years.
Frequently Asked Questions
What percentage of PhD students drop out worldwide?
Globally, estimates range from approximately 20% to 50% depending on country and discipline. US data from the Council of Graduate Schools puts the ten-year attrition rate at roughly 43% (completion rate ~57%). The Netherlands reports dropout rates near 50%. The UK average is around 19.5% across 14 institutions. Australia performs best among major research systems, with approximately 80% of candidates completing within the normative timeframe.
Which country has the highest PhD completion rate?
Australia consistently reports the highest PhD completion rates among countries with comparable published data, with close to 80% of candidates completing within their normative enrollment period — significantly above the US figure (~57% over ten years) and the Netherlands (~50%). Australian institutional reforms introduced from the late 2000s, including formal milestone reviews and stricter candidature management, are credited with driving this outcome.
What is the PhD dropout rate by field?
Natural sciences and engineering consistently record the lowest dropout rates. Dutch longitudinal data puts natural science completion at around 62% and social science completion at around 29% within the same observation window. Law has the highest documented dropout rate in the Netherlands (~40%). In the UK, education doctorates can reach 45% dropout at some institutions. Humanities programs across all countries report below-average completion rates paired with the longest median time-to-degree.
How long does a PhD take on average?
In the United States, the median registered time-to-degree is approximately 5.7 years according to NSF Survey of Earned Doctorates data, though total graduate school time averages 7.2 years when prior master’s work is included. Engineering graduates reach the degree fastest (~5.3 years); humanities candidates typically take 7 years or more. UK and Australian normative completion timelines are commonly 3–4 years for full-time candidates, though actual time-to-degree frequently exceeds this.
What are the main reasons PhD students drop out?
The primary drivers of PhD attrition documented across multiple national studies include: poor supervisor relationship or limited supervisory contact; mental health deterioration from isolation and financial pressure; stipends that don’t cover local living costs; disillusionment with academic career prospects in a narrow tenure-track market; and lack of structural support during the dissertation-writing phase after coursework ends. Most exits result from the cumulative interaction of several of these factors rather than a single decisive event.
What happens if you fail your PhD viva in the UK?
Outright failure of a UK PhD viva — receiving neither a PhD nor a conditional pass — is rare: Discover PhDs data puts the rate at approximately 3.3% of candidates who reach the viva stage. The majority of viva “failures” result in the award of an MPhil rather than complete non-completion, or in a referral to revise and resubmit the thesis within a specified period, typically six to twelve months.
Manage Your Doctoral Journey With Structure
The data above makes clear that structure and sustained support separate doctoral candidates who finish from those who don’t. The dissertation phase — managing large-scale writing, maintaining momentum through isolation, and meeting supervisor expectations — is where most attrition accumulates. Candidates who have a clear chapter framework, an organised reference system, and a way to check their own originality before submission are measurably better positioned to complete.
Try Tesify free — an integrity-first AI thesis assistant that helps you structure chapters, manage references, and run originality self-checks so your time in the program produces a completed dissertation, not a statistic in the attrition column.
Write your thesis with AI
Structure, draft, cite, and format your thesis faster with Tesify’s AI writing tools, automatic bibliography, and plagiarism checker. Free to start, no credit card required.






Leave a Reply