

How to Write the Results Chapter of an Economics Dissertation (2026): Regression Tables, Robustness Checks and Economic Significance
An economics results chapter fails for a different reason than a psychology or nursing one. The numbers are usually right; the argument around them is not. A student runs the regression, pastes the output, reports which coefficients carry stars, and stops — leaving the examiner to ask the two questions economics always asks: how big is this effect in a world that matters, and why should I believe the number is causal rather than coincidental? This guide walks through the shape economics departments expect: the regression table itself, the difference between statistical and economic significance, the robustness checks a reader assumes you ran even if you do not mention them, and the data and code disclosures journals and increasingly dissertation committees now require.
What an economics results chapter has to do differently
- Report magnitude before significance. A coefficient of 0.003 with three stars is not automatically interesting; a coefficient of 0.30 without stars might still be underpowered rather than false. State what the coefficient means in the units of your outcome before you state whether it is distinguishable from zero.
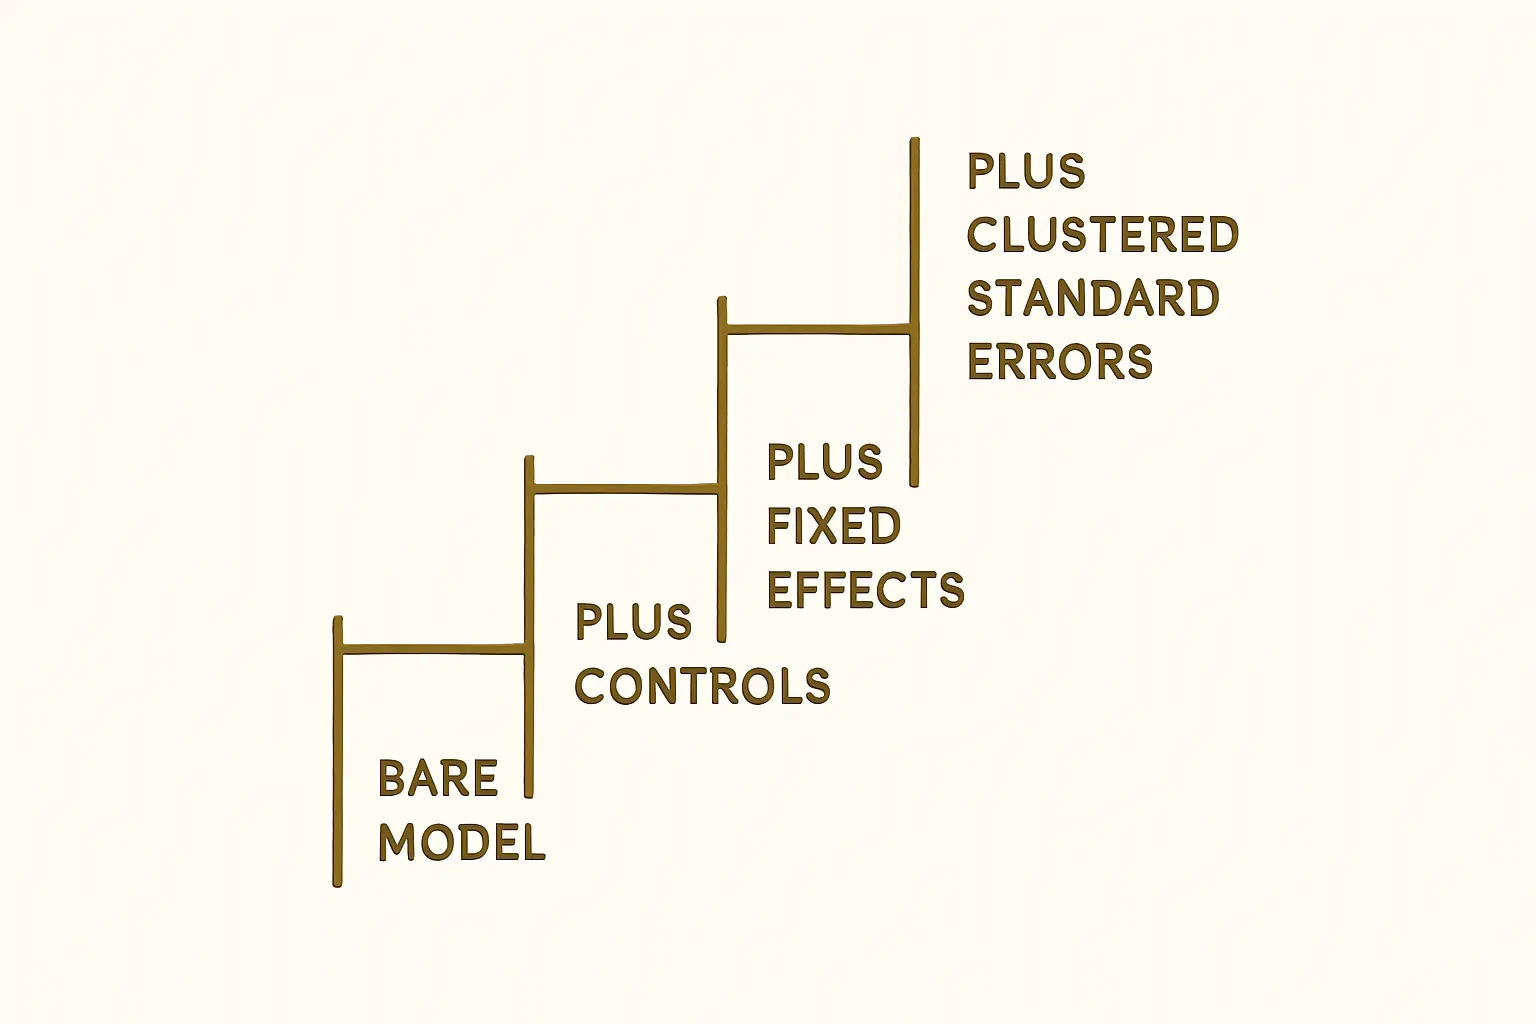
- Show the full specification ladder, not just your preferred model. Readers expect to see the estimate with no controls, with controls, and with fixed effects added one block at a time, so they can see whether your result survives or was manufactured by the controls you chose.
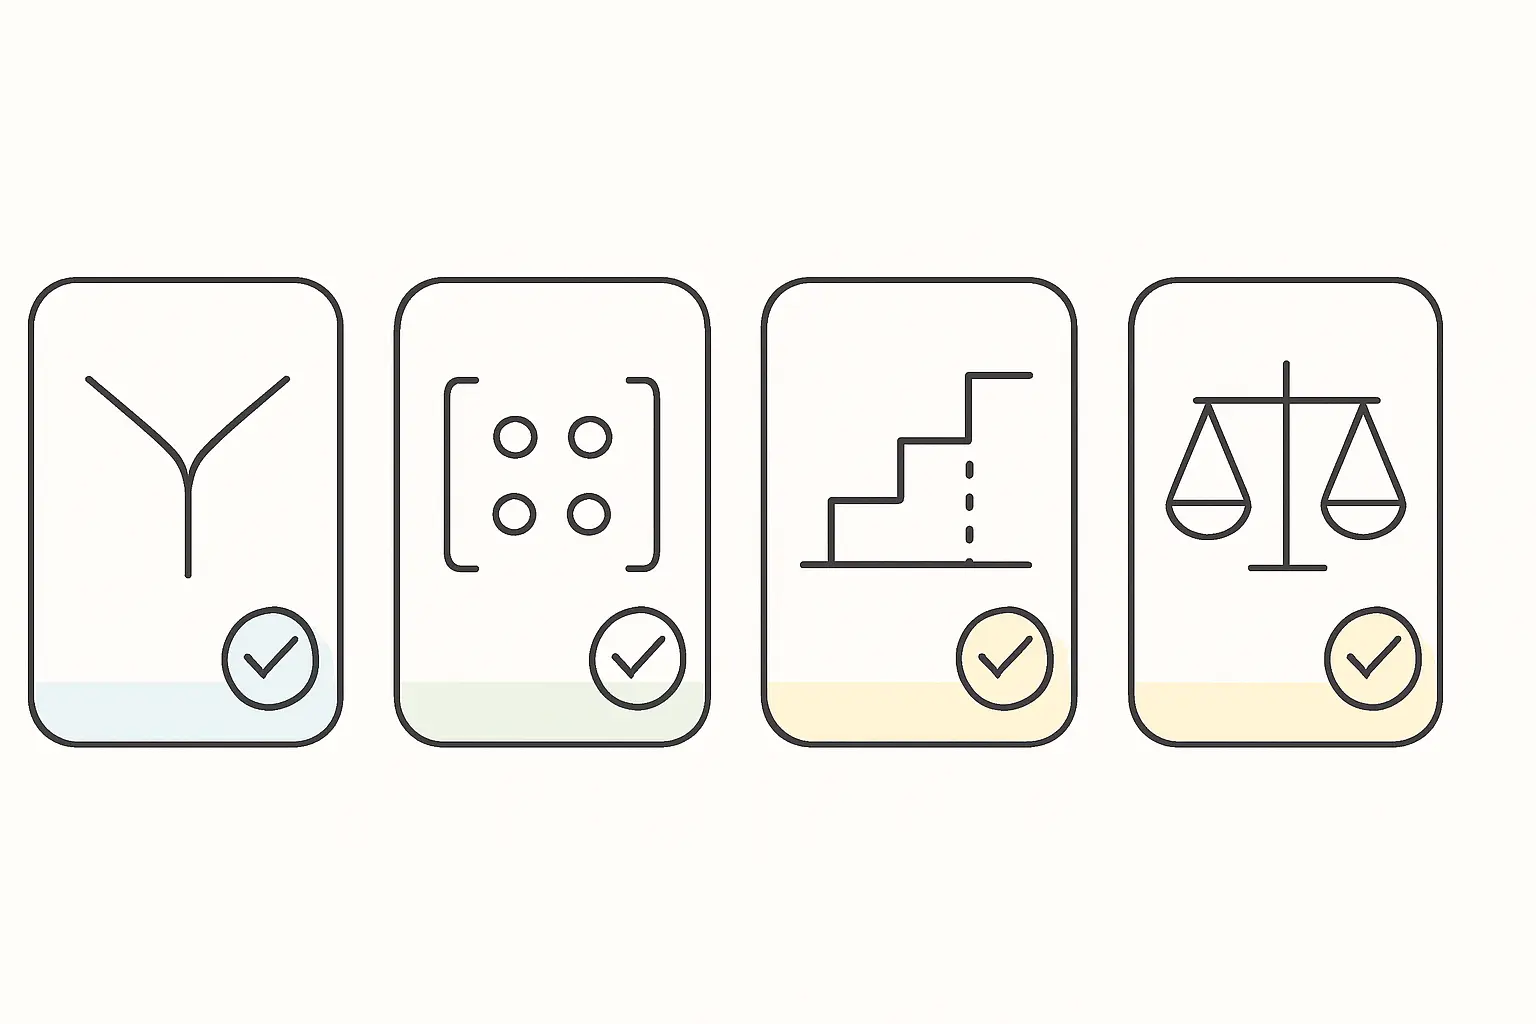
- Report robustness checks as a matter of course — alternative specifications, alternative samples, alternative standard-error clustering — not as an appendix nobody reads. Angrist and Pischke’s Mostly Harmless Econometrics (2009, Princeton University Press) is the standard reference economics committees expect you to have absorbed on this point.
- Name your identification threat honestly. Every non-experimental economics dissertation has one: omitted variables, reverse causality, or selection. Naming it and showing what you did about it is worth more than pretending the design is airtight.
- Disclose data and code. The American Economic Association’s Data and Code Availability Policy is now the norm your supervisor will hold you to even outside AEA journals.
Building the core regression table
Economics reports regression results in a standard table format that differs from the APA-style tables other fields use. Coefficients sit on one row, their standard errors in parentheses directly beneath, and asterisks mark conventional significance thresholds — typically * p<0.10, ** p<0.05, *** p<0.01, stated once in a note beneath the table rather than repeated in every cell. Columns move from a bare specification to your preferred one, and the bottom rows report sample size, R-squared, and which controls or fixed effects are “switched on” in each column with a simple Yes/No grid rather than restating every coefficient.
| Row | Column 1: bare | Column 2: + controls | Column 3: + fixed effects | Column 4: preferred |
|---|---|---|---|---|
| Key coefficient | reported | reported | reported | reported, discussed in text |
| Standard error | in parentheses | in parentheses | in parentheses | clustered, in parentheses |
| Controls | No | Yes | Yes | Yes |
| Fixed effects | No | No | Yes | Yes |
| Observations (N) | reported | reported | reported | reported |
| R-squared | reported | reported | reported | reported |
The text that follows the table does the work the table cannot: it says, in one sentence, what the preferred coefficient means in the units a reader can picture, and it explains in one more sentence why the coefficient moved — or did not move — as controls and fixed effects were added. A coefficient that survives every column unchanged is a stronger causal claim than one that halves the moment region fixed effects appear.
Statistical significance is not the finish line
A p-value tells you whether an effect is distinguishable from zero given your sample; it says nothing about whether the effect is large enough to matter. Economics dissertations are marked down for stopping at the stars. The fix is to convert the coefficient into a quantity a reader can evaluate: an elasticity, a percentage change, a dollar amount, or a share of a standard deviation. If a wage regression returns a schooling coefficient of 0.08 on log wages, say plainly that one additional year of schooling is associated with an 8 percent higher wage, and then say whether 8 percent is large relative to the literature on returns to schooling in your setting.
The clearest illustration in the field is Card and Krueger’s 1994 study of the New Jersey minimum-wage increase, published in the American Economic Review (84(4), 772–793). Their finding — that employment did not fall, and if anything rose slightly, in fast-food restaurants after the minimum wage increased — was contested for two decades precisely because the debate was never really about statistical significance. It was about whether the estimated effect, whatever its precision, was consistent with a competitive labor market or a monopsonistic one. Frame your own results chapter the same way: state the economic model your coefficient is consistent with, not just its p-value.
Robustness checks the reader assumes you ran
A results chapter that reports one specification and calls it a day invites the examiner to run the checks themselves, out loud, in the viva. Build them in instead:
- Alternative specifications. Re-estimate with a different functional form (levels versus logs), a different control set, or a different sample window, and report whether the sign and rough magnitude hold.
- Alternative standard errors. Clustering choice changes inference more than students expect. Bertrand, Duflo and Mullainathan (2004), in the Quarterly Journal of Economics (119(1), 249–275), showed that ignoring serial correlation in panel and difference-in-differences designs can make standard errors dramatically too small, manufacturing significance that is not really there. State how you clustered and why.
- Placebo or falsification tests. If your design is a difference-in-differences or an event study, show that the treatment and control groups moved together before the policy change — the parallel-trends check — and that a fake treatment date placed before the real one produces no effect.
- Subsample splits. Re-run the main specification on a subsample where the effect should be stronger or weaker on theoretical grounds, and check that the split behaves as the theory predicts.
Naming your identification threat honestly
Every non-experimental economics dissertation carries at least one of three threats: an omitted variable correlated with both the regressor and the outcome, reverse causality running from the outcome back to the regressor, or selection into the sample or the treatment. Angrist and Krueger’s 2001 review in the Journal of Economic Perspectives (15(4), 69–85) frames the whole identification project as the search for variation that looks as good as randomly assigned. Your results chapter earns credibility by stating which threat is most plausible for your design, what you did to address it — fixed effects, an instrument, a discontinuity, or simply a candid limitation — and what would have to be true for the threat to overturn your conclusion. Our companion guide on choosing an identification strategy covers how to select the design before you get to this chapter; this is where you defend the choice in front of the results it produced.
Heterogeneity: when the average effect hides the interesting story
An average treatment effect can mask two offsetting effects in different subgroups. Report heterogeneity by theoretically motivated subgroups — by firm size, by region, by income tercile, by pre-period trend — rather than by every variable available, which invites the accusation of specification searching. State the subgroup split before you look at the results if your design allows it, and report the interaction coefficient and its standard error alongside the subgroup means, not just a bar chart.
Comparing your estimate to the literature
A number in isolation means little to an examiner who has read the literature review you wrote two chapters earlier. Put your point estimate next to the two or three closest published estimates in a short table or a sentence: is your coefficient larger, smaller, or indistinguishable from Smith (2019) or the meta-analysis you cited in Chapter 2? If it differs, say why — a different country, a different time period, a different identification strategy — rather than leaving the reader to wonder whether the difference is a finding or a mistake.
Data and code: what committees now expect
The American Economic Association’s Data and Code Availability Policy requires authors to provide materials “sufficient to permit replication” in an openly accessible repository, with a data-availability statement describing how an independent researcher can access the original data, and a README explaining every step from raw data to final table. Even outside AEA-affiliated journals, this is now the norm your supervisor will expect: a replication package containing your raw or restricted-access data documentation, your cleaning and analysis code, and a plain-language README, deposited alongside your dissertation or in a repository your university endorses. Where your data cannot be shared publicly — confidential survey microdata, licensed panel data, administrative records — document the access route and contact rather than omitting the disclosure altogether; committees increasingly ask for this in the viva regardless of whether the handbook mentions it.
If your dissertation includes an experiment or a randomized intervention, note whether it was pre-registered on the AEA RCT Registry before data collection, and if not, say so plainly rather than presenting exploratory analysis as confirmatory. Include the standard JEL classification codes for your topic on the title page or abstract; committees and examiners use them to place your work in the field before reading a word further.
Common mistakes in an economics results chapter
- Reporting only the preferred specification. Show the ladder, not just the final column.
- Treating a p-value as a verdict on importance. State the magnitude in real units first.
- Skipping the robustness section because the main result “looked fine.” The examiner will ask for it if you do not provide it.
- Describing a correlational design in causal language. If you did not identify a causal effect, say “associated with,” not “causes.”
- Leaving out the data and code statement. Even a one-paragraph disclosure now reads as a basic competence signal, not an optional extra.
Draft your economics results chapter with the argument built in
Give Tesify your regression output, your specification ladder and your robustness checks, and it drafts the results chapter with the magnitude stated in plain language, the identification threat named, and every table formatted the way economics departments expect — referenced and ready for your supervisor’s first read.
Start your economics dissertation with Tesify, free to begin
The results chapter sits inside the wider document our step-by-step guide to writing a thesis results chapter covers in general form, before the field-specific choices this guide makes. For the mechanics of turning any results chapter into APA-adjacent prose faster, see writing a results chapter faster with AI, and for where AI can and cannot help an economics dissertation specifically, see writing an economics dissertation with AI. A results chapter with the opposite problem — a field where the raw numbers, not the causal claim, are the whole chapter — is covered in our guide to writing a sports science dissertation results chapter, and a quantitative discipline one step further from economics again is covered in our guide to choosing a methodology for a data science or machine learning dissertation.
Frequently asked questions
Do I need stars (*, **, ***) in my economics regression table?
Yes, they are the field convention, but define the thresholds once in a table note — typically p<0.10, p<0.05 and p<0.01 — and never let the stars substitute for a sentence stating the coefficient’s magnitude in real units.
How many robustness checks does a dissertation need?
Enough to address the specific identification threat your design carries: at minimum one alternative specification, one alternative standard-error clustering choice, and a falsification or placebo check if your design allows one. More is not automatically better; each check should answer a question a reader would actually ask.
What is the difference between statistical and economic significance?
Statistical significance says an estimate is unlikely to be zero given your sample and its noise. Economic significance says the estimate is large enough, in real units such as dollars, percentage points or elasticities, to matter for the theory or policy question the dissertation asks. A result can have one without the other.
Do I have to share my data and code for a dissertation, not just a journal submission?
Increasingly, yes in spirit. Most universities do not enforce the AEA’s formal repository requirement for a dissertation, but committees now expect a replication-style appendix: your cleaning code, your analysis code, and a README, with a documented access route for any data you cannot share publicly.
How do I report a null or insignificant result in an economics dissertation?
Report it as precisely as a significant one: the point estimate, its standard error, and a power calculation or confidence interval showing what effect sizes your design could and could not have detected. A null result with a wide confidence interval is uninformative; a null result with a tight one is a real finding.
Should I include an appendix with every regression I ran?
Include the specifications that inform the reader’s judgement of robustness — the ladder, the robustness checks, the heterogeneity splits — in a labeled appendix table, but do not paste every exploratory regression from your working files. An appendix of unexplained regressions reads as evidence of specification searching, not transparency.
Write your thesis with AI
Structure, draft, cite, and format your thesis faster with Tesify’s AI writing tools, automatic bibliography, and plagiarism checker. Free to start, no credit card required.






Leave a Reply