

The Hidden Cost of Peer Review in 2026: What Researchers’ Unpaid Reviewing Time Is Actually Worth (Sourced Data)
Every year, researchers around the world write tens of millions of peer review reports for which they receive no pay, no formal career credit, and almost no institutional recognition. The peer review unpaid labor value embedded in this system runs into the billions of dollars annually — yet the figure rarely appears in any university budget, any publisher’s annual report, or any policy discussion about sustainable scholarly publishing. Academic publishing is a multi-billion-dollar industry built, in substantial part, on a workforce that clocks out and gets nothing.
This article compiles the best available sourced data on the total scale of unpaid reviewer labor: how many hours are donated globally, what those hours are worth in salary-equivalent terms, how the burden is distributed across countries and research fields, and how the crisis is deepening as reviewer acceptance rates collapse. Every statistic below is drawn from a named, verifiable source.
The Scale: 130 Million Hours of Unpaid Labor
The most comprehensive estimate of global peer review labor comes from Aczel, Szaszi, and Holcombe’s 2021 study published in Research Integrity and Peer Review, titled “A billion-dollar donation: estimating the cost of researchers’ time spent on peer review.” Using the Dimensions database — which covers approximately 87,000 journals — and a conservative assumption of six hours per review, the authors calculated that researchers completed 21.8 million peer reviews in 2020, investing a total of 130.8 million hours.
To put that in human terms: 130.8 million hours is equivalent to nearly 15,000 years of continuous, uninterrupted work. All of it performed voluntarily. All of it outside the scope of any employment contract. All of it subsidizing an industry with annual revenues estimated in the tens of billions of dollars.
An earlier benchmark from the Publons Global State of Peer Review 2018 report — which surveyed more than 11,000 researchers and drew on data from the ScholarOne manuscript platform and Web of Science — put the total at 68.5 million hours globally per year (equivalent to 7,800 researcher-years). The growth from 68.5 million hours in 2018 to 130.8 million hours in 2020 partly reflects the rapid expansion of global article output and the surge in COVID-19-related submissions, but it also reflects more complete database coverage in the later study. Both figures are conservative underestimates by their authors’ own admission.
| Metric | Figure | Source |
|---|---|---|
| Total reviews completed globally (2020) | 21.8 million | Aczel et al. (2021) |
| Total hours donated globally (2020) | 130.8 million hours | Aczel et al. (2021) |
| Equivalent in researcher-years | ~14,900 years | Aczel et al. (2021) |
| Total hours globally (2018 estimate) | 68.5 million hours | Publons GSPR (2018) |
| Average reviews per researcher per year | 4.73 | Aczel et al. (2021) |
Peer Review Unpaid Labor Value: What the Numbers Show
Translating hours into dollars requires wage assumptions, which is where different methodologies produce significantly different results. Two major studies bracket the realistic range.
Aczel et al. (2021) applied country-specific median academic salaries — $69.25/hour for US-based researchers, $57.21/hour for UK-based researchers, and $33.26/hour for China-based researchers — to their database-derived review counts. Their resulting country-specific value estimates represent the salary equivalent of what that reviewing time would cost if institutions had to pay for it.
LeBlanc et al. (2023), publishing in PLOS ONE under the title “Scientific sinkhole: estimating the cost of peer review based on survey data with snowball sampling,” used a direct-survey approach with 308 respondents across 33 countries. Their median respondent earned US$90,000 annually, completed six initial reviews and three re-reviews per year, and invested roughly 30 hours total. Scaling those individual costs up to the global article output yielded two estimates: a conservative Scopus-based figure of $1.1–1.7 billion per year (covering only published articles), and a comprehensive Dimensions-based figure of $6 billion in 2020 once rejected-but-reviewed manuscripts are included.
These figures are not contradictory. The Aczel country-specific estimates ($1.5B for the US alone) and the LeBlanc global Scopus estimate ($1.1–1.7B) reflect different scopes: one covers a single country, the other covers the global published-article pool only. The $6 billion figure is the most complete because it accounts for the enormous volume of reviewing done on papers that never appear in print.
Hours Per Review and the Individual Reviewer Burden
How many hours does a single peer review actually take? The two major studies use different measurement approaches and arrive at different medians, both of which are instructive.
Aczel et al. (2021) used a conservative fixed assumption of 6 hours per review, citing a 2009 survey as the basis. LeBlanc et al. (2023) collected direct self-report data and found a median of 4 hours for an initial review (interquartile range: 3–6 hours) and 2 hours for a re-review (IQR: 1–2 hours). The Publons 2018 report, measuring elapsed calendar time rather than active working hours, recorded an average of 19.1 days from invitation acceptance to report submission — a figure that captures the entire cognitive and scheduling burden, not just keyboard time.
The individual burden, aggregated across a research career, is substantial. The LeBlanc et al. survey found a median commitment of approximately 30 hours per year per active reviewer. For a mid-career researcher completing six initial reviews and three re-reviews annually — the survey median — that is roughly one full working week donated to the publishing system, every year, without pay.
The distribution is highly skewed. Aczel et al. note that some reviewers complete more than 1,000 reviews per year, representing an extreme end of the distribution that inflates aggregate totals while placing extraordinary burden on a small number of individuals.
| Measure | Figure | Source |
|---|---|---|
| Assumed hours per review (model input) | 6 hours | Aczel et al. (2021) |
| Median hours: initial review (self-reported) | 4 hours (IQR 3–6) | LeBlanc et al. (2023) |
| Median hours: re-review (self-reported) | 2 hours (IQR 1–2) | LeBlanc et al. (2023) |
| Annual hours per active reviewer (median) | ~30 hours | LeBlanc et al. (2023) |
| Average calendar days from acceptance to report | 19.1 days | Publons GSPR (2018) |
| Median annual cost per reviewer (salary-equivalent) | US$1,272 | LeBlanc et al. (2023) |
For context on what these reviewing timelines mean for authors, see the companion data piece on journal peer review time statistics by field, which documents first-decision timelines across 57 journals in detail.
Value by Country
Aczel et al. (2021) produced country-specific salary-equivalent estimates, applying local median academic hourly wages to their country-attributed review counts. The three largest contributors by monetary value were:
| Country | Estimated Value (2020) | Hourly Rate Applied | Source |
|---|---|---|---|
| United States | $1.51 billion | $69.25/hr | Aczel et al. (2021) |
| China | $626 million | $33.26/hr | Aczel et al. (2021) |
| United Kingdom | $391 million | $57.21/hr | Aczel et al. (2021) |
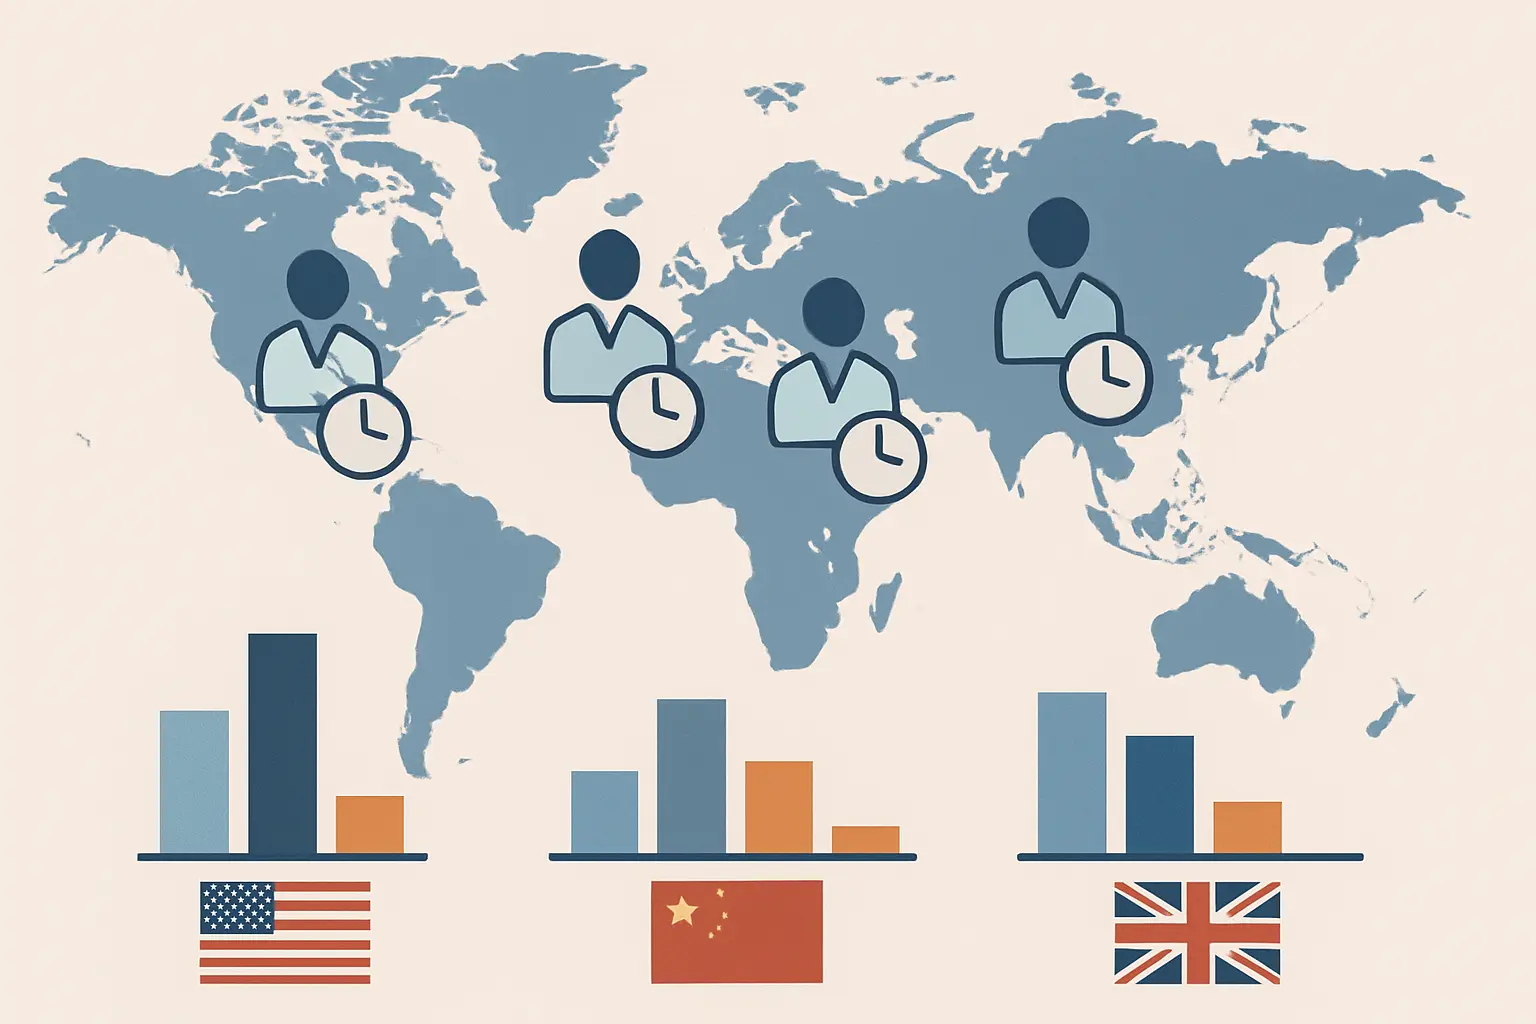
These figures represent salary-equivalent cost only — what institutions would need to pay if they compensated reviewers at median academic wages. They exclude overhead, training time, and the opportunity cost of research time displaced by reviewing. The authors explicitly characterize these as underestimates, noting that the Dimensions database does not capture all journals operating globally and that their model does not account for multiple rounds of revision on the same manuscript.
The China figure merits attention. Despite a lower hourly rate, China’s volume of reviewing is large enough to rank second globally — a consequence of rapid growth in both Chinese research output and Chinese participation in international peer review over the past decade.
The Hidden Cost Within the Hidden Cost: Rejected Manuscripts
Perhaps the most underappreciated dimension of peer review’s economic footprint is the reviewing done on papers that never get published. A manuscript rejected at one journal may be resubmitted to several others in sequence, receiving full peer review at each. Under the Aczel et al. model, which assumed a 30% acceptance rate and a 45% desk-rejection rate, a large share of the reviewing corpus goes toward manuscripts that will ultimately be rejected or redirected.
LeBlanc et al. (2023) model this explicitly. Their conservative estimate — covering only accepted, published articles — produces a global total of $1.1–1.7 billion annually (using Scopus coverage). Their comprehensive estimate, which adds the reviewing done on rejected manuscripts, reaches $6 billion in 2020. The gap between those two figures — roughly $4–5 billion — represents the economic value of labor performed on research that readers will never see in print.
This is relevant to any discussion of journal acceptance rates: highly selective journals with single-digit acceptance rates are, in effect, generating enormous quantities of unpaid review labor per published paper. A journal with a 5% acceptance rate requires roughly 20 reviewed submissions for every article it publishes.
Time Trends and the Growing Reviewer Shortage
The total volume of unpaid reviewing labor is not stable — it is increasing in aggregate while becoming harder to recruit in practice. These two trends coexist because the growth in article submissions outpaces the growth in the pool of willing reviewers.
The journal Cyberpsychology: Journal of Psychosocial Research on Cyberspace published detailed recruitment statistics across three consecutive years that illustrate the crisis concretely. To cover the review needs of 83 articles in 2023, editors contacted 2,183 potential reviewers — 26.3 invitations per article, up from 23 per article in 2022 and 12 per article in 2021. Of the 2,183 invitations sent in 2023, only 11.7% were accepted, 32.3% were explicitly declined, and 54.8% received no response at all.
A larger-scale analysis across 21 biomedical journals (PMC10471900) found that of 180,092 reviewer invitations, 37.2% were agreed — and that 87% of those who agreed ultimately completed their review. The bottleneck, in other words, is not reviewer follow-through; it is reviewer willingness to agree in the first place.
A 2025 study published in Biological Invasions (Springer Nature) analyzed 21 years of reviewer invitation data from a single journal (2002–2024) and found a long-term declining trend in acceptance rates converging with rising decline rates — confirming that what some have called “reviewer fatigue” is a structural, multi-decade phenomenon, not a temporary post-pandemic artifact.
The implications for authors are significant: more invitations per article means longer waits before enough reviewers agree to submit reports, extending first-decision timelines. That dynamic is explored in depth in the peer review time statistics data roundup.
What Structural Reform Could Save

Several reform proposals have circulated in the scholarly publishing literature, and at least one has a quantified potential saving attached to it.
Aczel et al. (2021) calculate that if journals adopted portable peer review — a system in which a reviewer’s report travels with a manuscript when it is rejected and resubmitted elsewhere — the US alone could save approximately 28 million hours and $300 million annually. Under portable peer review, a reviewer who evaluates a manuscript for Journal A would not need to be re-recruited if the same paper is resubmitted to Journal B. The report would transfer, the editor at Journal B would decide whether to trust it or commission supplementary review, and the reviewer would not be asked to repeat the same work.
Cascading submission systems (such as those operated by some publisher groups, where rejected papers can be transferred between titles with review reports intact) implement a version of this principle. Their adoption remains partial and voluntary.
Other proposed mechanisms — reviewer recognition platforms, mandatory disclosure of review time in journal metrics, formal credit in promotion and tenure criteria — lack comparable monetary quantification but address the recognition deficit that LeBlanc et al. identify as the structural root cause: 87.5% of reviewers receive nothing, and career incentives do not reward time spent reviewing.
For researchers navigating the current system, understanding the economics of open access publishing — including how APCs relate to the labor that underpins publishing — is relevant context. The APC cost breakdown by publisher covers what journals charge authors for open access, against a backdrop where peer review itself costs publishers nothing in direct labor.
Implications for Researchers and Institutions
The data assembled here points to several structural conclusions worth stating directly.
Publishers externalize a major cost center. The publishing industry’s core quality-assurance function — peer review — is funded not by publishers but by universities and research funders, via the salaries of the academics who perform it. A journal that charges $3,000 in article processing charges and pays reviewers nothing is capturing revenue while externalizing labor costs onto the institutions that fund those reviewers’ salaries.
Reviewer burden is concentrated. Aczel et al. note that some individuals complete more than 1,000 reviews per year. The Publons 2018 report found that a small proportion of the global reviewer pool completes a disproportionate share of total reviewing. This concentration is a structural vulnerability: when high-volume reviewers decline, the system’s throughput drops sharply.
Early-career researchers are disproportionately affected. ECRs frequently accept reviews that more senior colleagues decline — both to build recognition and because they feel less able to refuse. They do so at lower salary rates, meaning their labor is valued even lower in the Aczel framework, while the opportunity cost relative to their career stage may be higher.
Open peer review changes visibility, not compensation. The growth of journals that publish review reports (covered in the open peer review adoption data) creates a paper trail for reviewer contributions, but by itself does not alter the economic structure. Reviewers in open systems still receive no pay; they simply receive an attributed public record of their contribution.
Researchers using AI tools to manage literature and assist with manuscript preparation — including tools like Tesify — are working within a publishing system whose economics remain structurally dependent on this large pool of uncompensated expert labor. Understanding that dependency matters for anyone navigating publish-or-perish pressures, making decisions about where to submit, or evaluating whether to accept the next review invitation that arrives in their inbox.
Frequently Asked Questions
How many hours do researchers spend on peer review globally each year?
Aczel, Szaszi, and Holcombe (2021) estimated that researchers globally completed 21.8 million peer reviews in 2020, totaling approximately 130.8 million hours — equivalent to nearly 15,000 years of continuous work. An earlier estimate from the Publons Global State of Peer Review 2018 report put the figure at 68.5 million hours. Both studies describe their figures as conservative underestimates.
What is the monetary value of unpaid peer review labor?
Estimates vary by methodology and scope. Aczel et al. (2021) calculated a salary-equivalent value of more than $1.51 billion for US-based reviewers alone in 2020, $626 million for China-based reviewers, and $391 million for UK-based reviewers. LeBlanc et al. (2023) produced a comprehensive global estimate of approximately $6 billion per year when rejected manuscripts are included, and a Scopus-based conservative figure of $1.1–1.7 billion covering published articles only.
How long does a single peer review take?
LeBlanc et al. (2023) found a median of 4 hours for an initial review (IQR: 3–6 hours) and 2 hours for a re-review (IQR: 1–2 hours). Aczel et al. (2021) applied a conservative fixed assumption of 6 hours per review in their model. The Publons 2018 report recorded an average of 19.1 calendar days from invitation acceptance to report submission, reflecting scheduling demands on top of active writing time.
Do peer reviewers get paid for their work?
The overwhelming majority do not. LeBlanc et al. (2023) found that 87.5% of surveyed researchers reported never receiving any compensation for peer review work. Where compensation exists, it typically takes the form of minor discounts on article processing charges — a benefit of limited value in practice. No major commercial publisher routinely pays cash honoraria to peer reviewers.
How many reviews does the average researcher complete per year?
Aczel et al. (2021) calculated an average of 4.73 reviews per researcher per year across all active reviewers. LeBlanc et al. (2023) found a median of 6 initial reviews and 3 re-reviews per year among their survey respondents — a total of 9 peer review engagements per year, representing approximately 30 hours of work.
How difficult has it become for journals to recruit peer reviewers?
Recruitment has become significantly harder over recent years. Data from the journal Cyberpsychology showed that editors sent 26.3 invitations per article in 2023 to secure enough reviews — more than double the 12 invitations per article required in 2021. Only 11.7% of those approached accepted. Across 21 biomedical journals analyzed in a 2023 PMC study, the overall invitation acceptance rate was 37.2%, with 87% of those who agreed going on to complete their review.
Writing research and managing sources?
Tesify helps researchers and postgraduates structure arguments, manage citations, and draft complex academic content faster. Try Tesify — it’s free to start.
Write your thesis with AI
Structure, draft, cite, and format your thesis faster with Tesify’s AI writing tools, automatic bibliography, and plagiarism checker. Free to start, no credit card required.





Leave a Reply