How to Draw a PRISMA 2020 Flow Diagram for Your Systematic Review (2026)
The PRISMA 2020 flow diagram is the single most scrutinised figure in any systematic review. Editors use it to judge your rigour before reading your methods section, supervisors use it to spot gaps in your search strategy, and journal peer reviewers return manuscripts over miscounts that a careful template check would have caught. If you are writing a systematic or scoping review for your dissertation, thesis, or first publication in 2026, understanding exactly how to draw this diagram — which boxes to use, where each number comes from, and which tool produces a publication-quality output — will save you days of revision.
This guide follows the official PRISMA 2020 statement published by Page et al. in BMJ 2021 (doi:10.1136/bmj.n71) and the official PRISMA statement website. Every box label and phase structure below reflects the current 2020 standard — not the superseded 2009 version that is still floating around on older university websites.
Why PRISMA 2020 — and What Changed from 2009
PRISMA stands for Preferred Reporting Items for Systematic reviews and Meta-Analyses. The original 2009 statement established a 27-item checklist and a four-phase flow diagram that became the reporting standard for biomedical and social science systematic reviews worldwide. By 2020, evidence synthesis methods had advanced substantially — automation tools, machine-learning screening, preprint searches, and open-access repositories had all entered mainstream practice — and the 2009 diagram no longer captured how modern reviews were actually conducted.
The 2020 update, led by Matthew Page and colleagues at Monash University, made three structural changes to the flow diagram that affect how you draw it:
- Split Identification column. The original diagram had a single “Identification” box. PRISMA 2020 separates records from databases and registers (left column) from records from other methods — citation searching, website searching, grey literature — (right column). This distinction matters because it shows readers exactly where your evidence base came from.
- Expanded removal box. The 2020 diagram adds explicit boxes for records removed before screening: duplicates, records excluded by automation tools, and records excluded for other reasons. The 2009 version only mentioned duplicates.
- Clearer “reports” language. The 2020 standard uses “reports” rather than “articles” at the full-text stage to acknowledge that a single study may be described across multiple reports (e.g., a trial with a main paper plus a protocol paper).
If your university’s methodology template still shows a 2009-style four-box diagram, flag it. Most journals now require the 2020 version, and supervisors who ask you to use the old format are inadvertently directing you towards a diagram that will need updating before submission to any indexed journal.
The Two Template Versions: Which One Do You Need?
PRISMA 2020 provides four official templates, but they reduce to two structural choices:
| Review type | Template to use | Right-side column present? |
|---|---|---|
| New review — databases and registers only | Version 1 (new) | No |
| New review — databases, registers, and other methods | Version 2 (new) | Yes — “Other methods” column |
| Updated review — databases and registers only | Version 1 (updated) | No, but includes box for previous version’s studies |
| Updated review — databases, registers, and other methods | Version 2 (updated) | Yes — plus previous version box |
For most dissertation systematic reviews, you will use Version 2 (new), because searching grey literature — government reports, clinical guidelines, theses, preprints — is expected at postgraduate level. If your protocol genuinely only searched bibliographic databases and trial registers with no hand-searching or grey literature, Version 1 is appropriate. When in doubt, use Version 2 and fill in the “other methods” column even if those searches returned zero records.
A strong approach to grey literature and where to find it is covered in the guide to what grey literature is and how to cite it in systematic reviews, which explains the AACODS appraisal checklist and major sources like OpenGrey, DART-Europe, and government repositories.
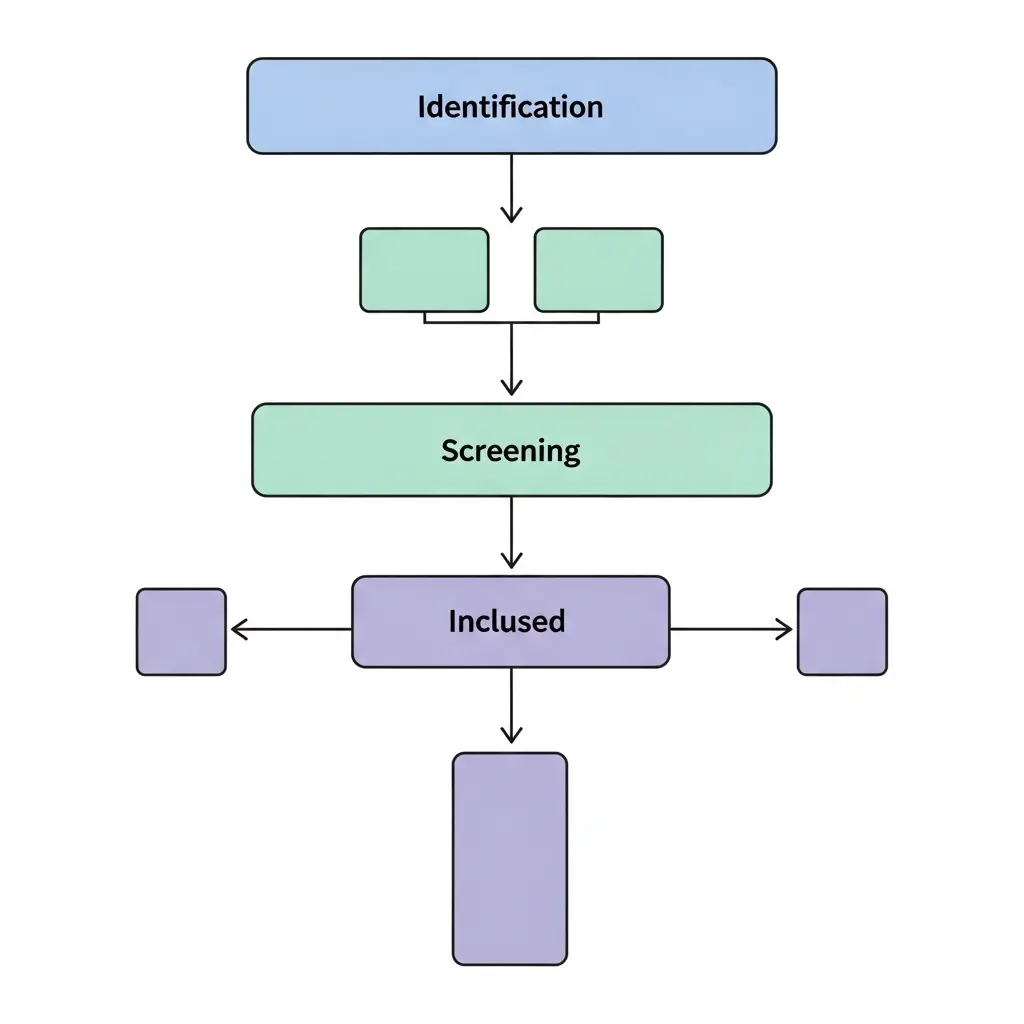
Anatomy of the PRISMA 2020 Flow Diagram: Every Box Explained
The diagram reads top-to-bottom through three labelled phases. The left column handles records from databases and registers; the right column (Version 2 only) handles records from other methods. At the Inclusion phase, the two columns merge into a single box.
Phase 1 — Identification
This phase captures everything you retrieved before any screening began.
- Records identified from databases (n=) — The raw total from all bibliographic databases combined (PubMed, Embase, PsycINFO, Scopus, CINAHL, Web of Science, etc.), counted before deduplication. Each database’s individual hit count should be noted in parentheses or in a supplementary search log (e.g., PubMed n=335, Embase n=512, Scopus n=211).
- Records identified from registers (n=) — Records from trial registries such as ClinicalTrials.gov, WHO ICTRP, ISRCTN, or the Cochrane Central Register of Controlled Trials (CENTRAL). If you did not search any registers, remove this box from your diagram (the grey optional boxes in the official template are meant to be deleted when not used).
- Records removed before screening (n=) — Broken into three sub-items in the 2020 standard: duplicate records removed (n=), records marked as ineligible by automation tools (n=), and records removed for other reasons (n=). Most student reviews will only have duplicates here; the automation-tool and other-reasons sub-boxes can be set to zero or omitted if not applicable.
Identification — Other Methods Column (Version 2)
- Records identified from websites (n=) — Structured searches of websites (e.g., WHO, NICE, CDC, professional body sites).
- Records identified from citation searching (n=) — Forward and backward citation searches from included studies.
- Records identified from other sources (n=) — Any additional method: contacting authors, personal communications, hand-searching journals.
Phase 2 — Screening
- Records screened (n=) — The total after removing duplicates: (Records identified from databases + registers) − Records removed before screening. This is the number you and your review team screened at title/abstract level.
- Records excluded (n=) — The number excluded at title/abstract screening. Exclusion reasons are not required at this stage but must be logged for full-text screening.
- Reports sought for retrieval (n=) — Records screened minus records excluded at T/A: the studies you attempted to obtain in full text.
- Reports not retrieved (n=) — Full texts you could not access despite attempting interlibrary loan, author contact, or open-access searches.
Phase 3 — Eligibility and Inclusion
- Reports assessed for eligibility (n=) — Reports sought minus reports not retrieved.
- Reports excluded (n=), with reasons — Each excluded full text must have at least one reason recorded (wrong population, wrong intervention, wrong outcome, wrong study design, etc.). The PRISMA 2020 standard requires these reasons to be listed with individual counts — e.g., “Wrong population (n=14), Wrong study design (n=8), Duplicate publication (n=3)”.
- Studies included in review (n=) — Your final count. In Version 2, this box combines studies from database/register searches and from other methods.
Step 1 — Record Your Database and Register Totals
Before you export any records, take a screenshot or note the hit count displayed by each database at the time of your search. Do not rely on counting records after they are imported; the export process sometimes drops records or adds duplicates from multi-format exports.
Recommended tracking format — create a simple table like this in a spreadsheet:
| Source | Type | Date searched | Hit count |
|---|---|---|---|
| PubMed | Database | 2026-03-10 | 335 |
| Embase (Ovid) | Database | 2026-03-10 | 512 |
| Scopus | Database | 2026-03-10 | 211 |
| ClinicalTrials.gov | Register | 2026-03-10 | 47 |
| NICE evidence search | Website/Grey | 2026-03-11 | 18 |
| Backward citation search | Citation | 2026-03-15 | 29 |
Your PRISMA diagram will then show: Databases (n=1,058), Registers (n=47) in the left column, and Website searching (n=18), Citation searching (n=29) in the right column. AI-assisted search tools such as those compared in our guide to Elicit vs Consensus vs Scite for systematic literature searches can supplement traditional database searches and should be logged under “Other methods” if used.
For more detail on structuring your search across multiple databases with Boolean operators and MeSH/controlled vocabulary, see the guide on how to do a literature review for your thesis.
Step 2 — Choose Your Template Version
With your source log completed, the choice of template version is straightforward: if any row in your table has “Website”, “Citation”, “Grey”, or “Other” in the Type column, use Version 2. Otherwise use Version 1.
Download the official Word templates from prisma-statement.org/prisma-2020-flow-diagram. The page offers four .docx templates — “New systematic review (with other sources)”, “New systematic review (without other sources)”, “Updated systematic review (with other sources)”, and “Updated systematic review (without other sources)”. Download the one that matches your review type.
If you prefer a programmatic approach, the PRISMA2020 R package and Shiny app by Haddaway, Page, Pritchard and McGuinness (2022) generates fully compliant SVG or PNG diagrams from a simple data entry interface — no R knowledge required if you use the web version at estech.shinyapps.io/prisma2020.
Step 3 — Remove Duplicates and Log the Count
Duplicate records arise because the same paper is indexed in multiple databases. When you export from PubMed, Embase, and Scopus simultaneously, a highly-cited paper will appear in all three exports. Your reference manager (Zotero, Mendeley, EndNote) or systematic review tool (Covidence) will identify most duplicates automatically, but automated deduplication is imperfect — always conduct a manual check of the suggested matches before confirming deletions.
The number to record in the “Records removed before screening — duplicates” box is the total number of records you deleted in this step, regardless of which databases produced the overlap. If you used Covidence, it tracks this for you and will auto-populate the figure in its PRISMA export.
Step 4 — Complete the Screening Phase
The Screening phase documents what happened when you read titles and abstracts against your inclusion and exclusion criteria.
Records screened (n=) is a calculated field, not a raw count:
Records screened = (Databases n= + Registers n=) − Records removed before screening n=
Using the worked example above: (1,058 + 47) − duplicates. If 312 duplicates were removed, Records screened = 793.
Records excluded (n=) at title/abstract screening — this is the number where, after reading the title and abstract, you were confident the record did not meet your criteria. For most systematic reviews, this is the largest exclusion number in the diagram. PRISMA 2020 does not require individual reasons at this stage (unlike full-text exclusions), but your screening log should record them for your own audit trail.
The literature review methodology framework explains how to write clear inclusion/exclusion criteria before screening begins — a step that directly determines how defensible your exclusion counts are to supervisors and reviewers.
Step 5 — Complete the Eligibility (Full-Text) Phase
Full-text eligibility is where precision matters most. You must be able to account for every record that passed title/abstract screening.
Reports sought for retrieval (n=) = Records screened − Records excluded at T/A screening. This is the number you tried to obtain in full text.
Reports not retrieved (n=) — Every record you attempted to retrieve but could not obtain. Common reasons: paywalled with no open-access version, article retracted, item in a language your institution cannot translate. Before recording a report as “not retrieved”, use your institution’s interlibrary loan service. If the full text genuinely cannot be obtained after a reasonable attempt, it must appear here — not silently dropped.
Reports assessed for eligibility (n=) = Reports sought − Reports not retrieved.
Reports excluded, with reasons (n=) — This is the most important box for peer reviewers. PRISMA 2020 requires you to list each exclusion reason with its count. Format it within the box as a bulleted or parenthetical list:
- Wrong population (n=14)
- Wrong intervention (n=8)
- Wrong study design (n=6)
- Wrong outcome (n=4)
- Duplicate publication (n=3)
- Conference abstract only — full paper unavailable (n=2)
Count each excluded report once, even if it met multiple exclusion criteria. Apply a hierarchy: if a study has the wrong population and wrong design, record it under whichever criterion you assessed first in your eligibility checklist.
Step 6 — Complete the Inclusion Box and Check Your Arithmetic
Studies included in review (n=) = Reports assessed for eligibility − Reports excluded at full-text.
In Version 2, the included box sits below a merge point where the database/register column and the other-methods column converge. The “other methods” side has its own parallel track: Records identified (other methods) → Reports sought → Reports not retrieved → Reports assessed → Reports excluded → Reports included. Sum the database-route inclusions and the other-methods-route inclusions to populate the single final “Studies included” box.
Identified (DBs) + Identified (Registers) − Removed before screening = Records screened
Records screened − Excluded T/A = Sought for retrieval
Sought − Not retrieved = Assessed for eligibility
Assessed − Excluded full-text = Studies included (DB/register route)
Identified (other) − Not retrieved (other) − Excluded (other) = Studies included (other route)
Included (DB route) + Included (other route) = Total studies included
If any row fails to balance, return to your screening log — not the diagram. The diagram reflects reality; it does not create it. If your review extends to a meta-analysis, your included studies will also feed into your funnel plot for assessing publication bias — see our guide to interpreting publication bias and funnel plots for that next step.
Step 7 — Generate the Diagram with the Right Tool
Once your numbers are verified, choose the generation method that fits your workflow:
Option A — PRISMA2020 Shiny App (Recommended for most students)
The Shiny app at estech.shinyapps.io/prisma2020 was developed by Haddaway, Page, Pritchard, and McGuinness and published in Campbell Systematic Reviews (2022). It accepts your numbers through a simple web form, lets you choose Version 1 or 2, and exports a vector SVG or high-resolution PNG that is suitable for journal submission. The interactive HTML version allows readers of your published review to click boxes and navigate to supplementary data — a feature increasingly expected in open-access publications.
Steps: open the app → select diagram type → enter each count → preview → download SVG (for journals) or PNG (for Word/thesis submission).
Option B — Covidence Auto-Export
If you managed your screening in Covidence, the platform automatically tracks every count as you import, screen, and exclude records. From the Review Summary page, click “PRISMA flow diagram” to download a pre-populated .docx. The export includes date stamps and Covidence branding in the footer, which you can remove when editing in Word. This is the fastest option for reviews conducted entirely within Covidence.
Option C — Official Word Template (Manual)
Download the relevant .docx from prisma-statement.org. The template uses a SmartArt-style layout with editable text boxes. Type your numbers directly into each box, delete any grey optional boxes that are not applicable, and save as a high-resolution image (File → Save a copy → PNG) for insertion into your thesis or manuscript. This method requires more careful formatting but gives you the most editorial control.
Option D — R Package (For R Users)
Install the PRISMA2020 package from CRAN: install.packages("PRISMA2020"). The package provides a PRISMA_data() function to create a structured input and a PRISMA_flowdiagram() function to render the diagram via ggplot2. This is the best option for reproducible research workflows where the diagram is generated programmatically from a script that also runs your meta-analysis.
Worked Example: A Completed Flow Diagram in Practice
To make the box structure concrete, here is a complete worked example for a hypothetical systematic review of digital cognitive behavioural therapy (dCBT) interventions for insomnia in university students.
Search conducted: March 2026. Databases: PubMed (n=335), Embase (n=512), PsycINFO (n=188), Scopus (n=211). Register: ClinicalTrials.gov (n=47). Other methods: NICE evidence search (n=18), backward citation search from 12 included studies (n=29).
| Box | Count | How derived |
|---|---|---|
| Records identified (databases) | 1,246 | 335+512+188+211 |
| Records identified (registers) | 47 | ClinicalTrials.gov hit count |
| Records removed before screening (duplicates) | 418 | Zotero deduplication |
| Records screened (T/A) | 875 | (1,246+47)−418 |
| Records excluded at T/A | 793 | Screening log |
| Reports sought for retrieval | 82 | 875−793 |
| Reports not retrieved | 5 | ILL requests unsuccessful |
| Reports assessed for eligibility | 77 | 82−5 |
| Reports excluded at full-text (with reasons) | 54 | Wrong population 18, wrong intervention 14, wrong design 12, wrong outcome 7, duplicate pub 3 |
| Studies included (DB/register route) | 23 | 77−54 |
| Records identified (other methods) | 47 | NICE 18 + citation search 29 |
| Reports assessed (other methods) | 47 | All retrieved |
| Reports excluded (other methods) | 45 | Eligibility screening |
| Studies included (other route) | 2 | 47−45 |
| Total studies included in review | 25 | 23+2 |
Every row in the table traces to a real log entry. Entering these twenty-four numbers into the Shiny app or Word template produces a completed PRISMA 2020 flow diagram that passes the arithmetic check and meets journal submission standards.
Six Common Mistakes and How to Avoid Them
1. Recording database totals after deduplication
The “Records identified” box must capture the raw, pre-deduplication hit counts. Some students run a combined search in one database interface and only record the deduplicated total. Always note the per-database count at the moment of export.
2. Using the 2009 flow diagram template
The 2009 version is still referenced in older methodology textbooks and some university thesis guides. It lacks the “other methods” column and the expanded removal box. If a journal asks for a PRISMA flow diagram without specifying the year, default to 2020 — it is now the standard referenced by CONSORT, Cochrane, and the WHO.
3. Leaving grey optional boxes blank rather than deleting them
Grey boxes in the template (such as the registers box or the automation-tool sub-item) are designed to be deleted if they do not apply. Leaving them in with “N/A” or “0” creates the impression that you included those methods in your review when you did not. Delete any box that represents a step you did not take.
4. Confusing “studies” and “reports”
A single study (a clinical trial, a cohort study) may have multiple associated reports (the main paper, a protocol paper, a follow-up paper). PRISMA 2020 uses “reports” at the retrieval and full-text stages and “studies” at the Inclusion box. If your review treats each report as a separate unit throughout, this distinction does not affect your counts — but if you identified multiple reports describing the same study, record the study once in the Inclusion box and note the discrepancy in your methods text.
5. Inconsistent full-text exclusion reasons
Exclusion reasons must be mutually exclusive and applied hierarchically. Without a predetermined exclusion hierarchy in your protocol, two reviewers will categorise the same paper under different reasons, making your reason counts unreliable. Agree on the hierarchy before full-text screening: typically Population → Intervention → Comparator → Outcome → Study Design.
6. Generating the diagram before numbers are finalised
The PRISMA diagram should be the last step in your methodology documentation workflow, not an early draft. Any change to your search date, an additional database, or a revised exclusion criterion after the diagram is drawn means regenerating it. Draw it once, from verified final numbers.
Frequently Asked Questions
What is the difference between PRISMA 2009 and PRISMA 2020?
PRISMA 2020 introduced three structural changes to the flow diagram. First, it split the Identification phase into separate columns for database/register searches and for other methods (grey literature, citation searching, website searching). Second, it added a dedicated box for records removed before screening — covering duplicates, automation-tool exclusions, and other pre-screening removals — rather than only mentioning duplicates. Third, it clarified the distinction between “reports” (individual documents) and “studies” (the underlying research units). The 27-item reporting checklist was also substantially revised, though the item count remained the same.
Do I need a PRISMA flow diagram in my dissertation?
If your dissertation uses a systematic review or scoping review methodology, a PRISMA flow diagram is expected by most universities and required by all indexed journals. Even for a structured narrative review, a simplified flow diagram showing how you selected sources strengthens your methodology chapter. Check your institution’s submission guidelines, but including one is rarely penalised and often rewards marks for rigour in the methodology section.
Which tool should I use to draw a PRISMA 2020 flow diagram?
The three most reliable options are: (1) the free PRISMA2020 Shiny app (estech.shinyapps.io/prisma2020), which generates publication-quality SVG or PNG diagrams from a web form — no software installation required; (2) Covidence, which auto-populates and exports a PRISMA .docx directly from your screening data if you managed your review there; and (3) the official Word templates from prisma-statement.org for fully manual control. For most dissertation students, the Shiny app is the fastest path to a clean, compliant diagram.
Where do the numbers in a PRISMA flow diagram come from?
Every number must come from a count you recorded during the review, not estimated after the fact. Database totals come from the hit counts shown in each database at the time of export. Duplicate counts come from your reference manager (Zotero, Mendeley, EndNote) or Covidence. Title/abstract screening counts come from your screening log or tool. Full-text exclusion counts — and their reasons — come from your eligibility assessment log. Keep a running spreadsheet throughout the review process; retrofitting numbers at write-up stage introduces errors that reviewers and supervisors will notice.
Can I use a PRISMA flow diagram for a scoping review?
Yes. The PRISMA-ScR extension for scoping reviews (Tricco et al., 2018) uses the same flow diagram structure as the standard PRISMA. The phases and box logic are identical; you label your review type as a scoping review and follow PRISMA-ScR item guidance for the 22-item reporting checklist. The PRISMA 2020 flow diagram templates from prisma-statement.org are appropriate to use for scoping reviews without modification.
What should I do if my PRISMA numbers do not add up?
Return to your screening log immediately — do not adjust the diagram to force balance. Work backwards from the Inclusion box: check that Assessed − Excluded (full-text) = Included; then Sought − Not retrieved = Assessed; then Screened − Excluded (T/A) = Sought; then Identified − Removed = Screened. The error will be in one of those transitions. Common causes: a batch of records imported from a second search was not added to the Identified total; excluded records at full text were logged twice; or a “not retrieved” record was later obtained and screened but not moved from the “not retrieved” count.
Write Your Systematic Review with AI Support
Tracking search counts across five databases, managing a deduplication log, and writing up your PRISMA methodology section simultaneously is one of the most time-consuming parts of a systematic review thesis. Tesify helps postgraduate students structure their methodology chapters, generate APA/Vancouver/Harvard citations automatically, and keep their literature management organised from protocol to final submission. The Tesify Auto Bibliography feature formats your reference list from your source log in any citation style in seconds — one less thing to audit before you hand in.
Write your thesis with AI
Structure, draft, cite, and format your thesis faster with Tesify’s AI writing tools, automatic bibliography, and plagiarism checker. Free to start, no credit card required.


Leave a Reply