

GIS, R or Excel: The Software Stack for an Environmental Science Thesis (2026)
Environmental science theses fail on tooling more often than almost any other applied science, not because the analysis is conceptually hard but because students pick software by familiarity rather than by what their specific data structure actually needs. A spatial dataset forced into Excel, a repeated-measures water-quality series treated with a t-test in SPSS, or a species-count model run without checking for overdispersion each produce results a committee will not accept — not because the student lacked ability, but because the tool did not match the data.
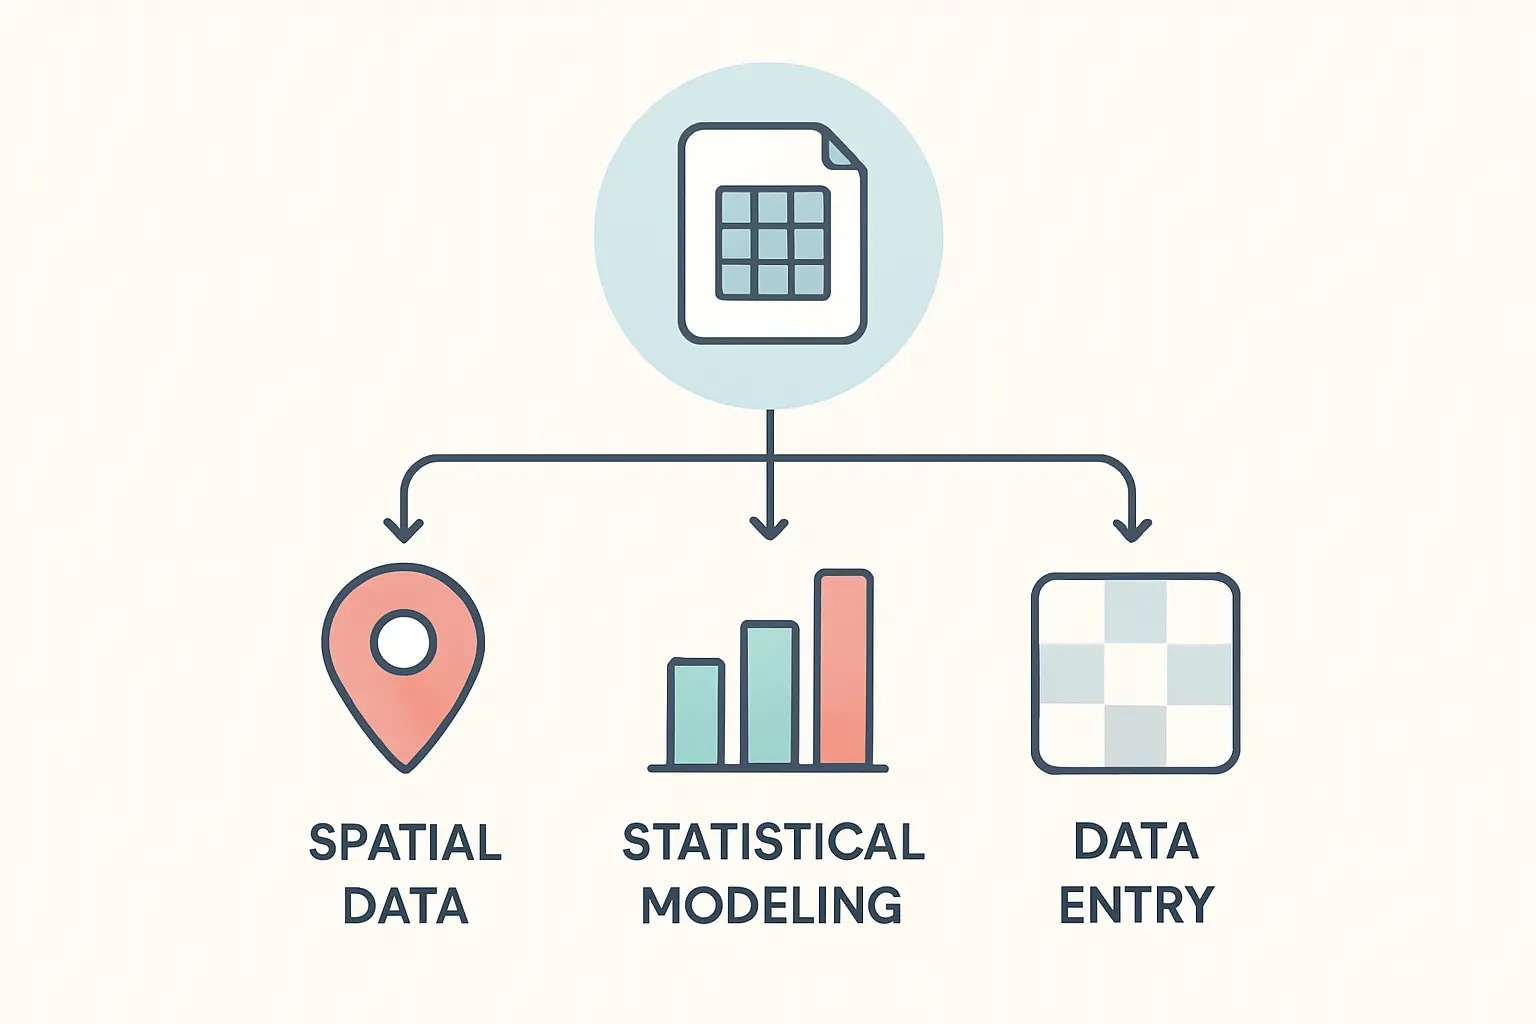
1. Decision Table: Data Structure to Tool
| Your data | Tool | Why |
|---|---|---|
| Sampling site coordinates, land-cover polygons, watershed boundaries | QGIS or ArcGIS Pro | Spatial joins, buffers and projections need a true GIS, not a spreadsheet with lat/long columns |
| Species counts, presence/absence, community composition | R (vegan, MASS, glmmTMB) | Count data usually violates normal-distribution assumptions; needs Poisson/negative-binomial GLMs or ordination methods Excel cannot run |
| Water quality or sensor time series with repeated measures | R (nlme, lme4) or, for simpler designs, jamovi | Repeated measurements at the same site are not independent; needs mixed-effects models, not repeated t-tests |
| Satellite or drone imagery | QGIS with the Semi-Automatic Classification Plugin, or Google Earth Engine | Classification, NDVI and change-detection workflows are purpose-built in these platforms |
| Simple summary stats, data entry, initial cleaning | Excel or Google Sheets | Fine for means, ranges and a first look — not for inferential modelling |
2. GIS: QGIS vs ArcGIS Pro
QGIS is free, open-source, and has closed most of the functionality gap with commercial GIS software over the past several years — for a student thesis, it is capable of everything from basic mapping to spatial statistics, watershed delineation and raster analysis. ArcGIS Pro remains the industry standard many environmental agencies and consultancies use day to day, and if your university provides a free institutional licence, learning it has a direct career-transfer benefit. For the thesis itself, the choice rarely affects what you can demonstrate methodologically — choose ArcGIS Pro if it is free through your institution and you want the resume-relevant experience; choose QGIS if licensing access is uncertain or you want a tool you can keep using after graduation without a subscription.
3. R for Ecological and Environmental Statistics
R is the de facto standard for ecological and environmental statistics because the packages built specifically for this kind of data are more complete than any point-and-click alternative:
- vegan — community ecology: ordination (NMDS, PCA), diversity indices, PERMANOVA for comparing community composition between sites or treatments.
- lme4 / nlme — mixed-effects models for repeated measures and nested designs (multiple samples per site, multiple sites per region).
- MASS / glmmTMB — generalised linear models for count data that violates normality, including overdispersed and zero-inflated counts common in species survey data.
- mgcv — generalised additive models, useful when a relationship (temperature and species abundance, for example) is expected to be non-linear rather than a straight line.
If R’s syntax is a genuine barrier, jamovi provides a free, GUI-driven front end that covers many of the same tests for simpler designs — a reasonable bridge for a bachelor’s-level thesis with a straightforward comparison, though it will not cover ordination or the more advanced mixed-model designs vegan and lme4 handle. Our comparison of JASP vs Jamovi vs SPSS vs R for thesis statistics covers the general trade-offs in more depth; the ecological-package gap described above is the environmental-science-specific reason R usually wins once your design gets more complex than a two-group comparison.
4. What Excel Is Actually For
Excel and Google Sheets have a real, legitimate role: entering raw field data in a consistent format, a first visual check for outliers or transcription errors, and simple descriptive summaries (means, ranges, a quick bar chart for a committee meeting). What they should not be asked to do is the inferential analysis itself — a repeated-measures water-quality dataset run as a series of independent t-tests in Excel will produce numbers, but they will be the wrong numbers, because Excel has no native way to model the non-independence between repeated samples at the same site. Keep Excel in the data-management role and move to R or a dedicated statistics package for anything beyond a description of what the raw numbers look like.
5. Remote Sensing and Imagery Tools
For theses using satellite or drone imagery — land-cover classification, vegetation-index time series, deforestation or urban-growth change detection — the standard stack adds a layer beyond general GIS:
- QGIS with the Semi-Automatic Classification Plugin — free, handles supervised classification of Landsat and Sentinel imagery directly inside a GIS environment.
- Google Earth Engine — free for research use, runs classification and time-series analysis on cloud-hosted imagery archives without downloading terabytes of raw scenes to a local machine, which matters for a multi-year change-detection design.
- R (raster / terra packages) — for students who want imagery processing inside the same environment as their statistical analysis, avoiding a separate GIS step entirely for simpler raster workflows.
6. Mapping the Stack to Your Thesis Steps
A practical way to plan your software stack is to map it against your actual thesis stages rather than picking one tool for everything: site selection and sampling-design mapping in GIS; raw data entry and first-look cleaning in a spreadsheet; the inferential analysis itself in R (or jamovi for simpler designs); and final publication-quality maps and figures back in GIS or R’s ggplot2. Committing to this division early avoids the common failure mode of doing everything in Excel because it is the only tool already open, then discovering at the results chapter that the analysis needed cannot actually be run there.
7. A Worked Pipeline (Illustrative)
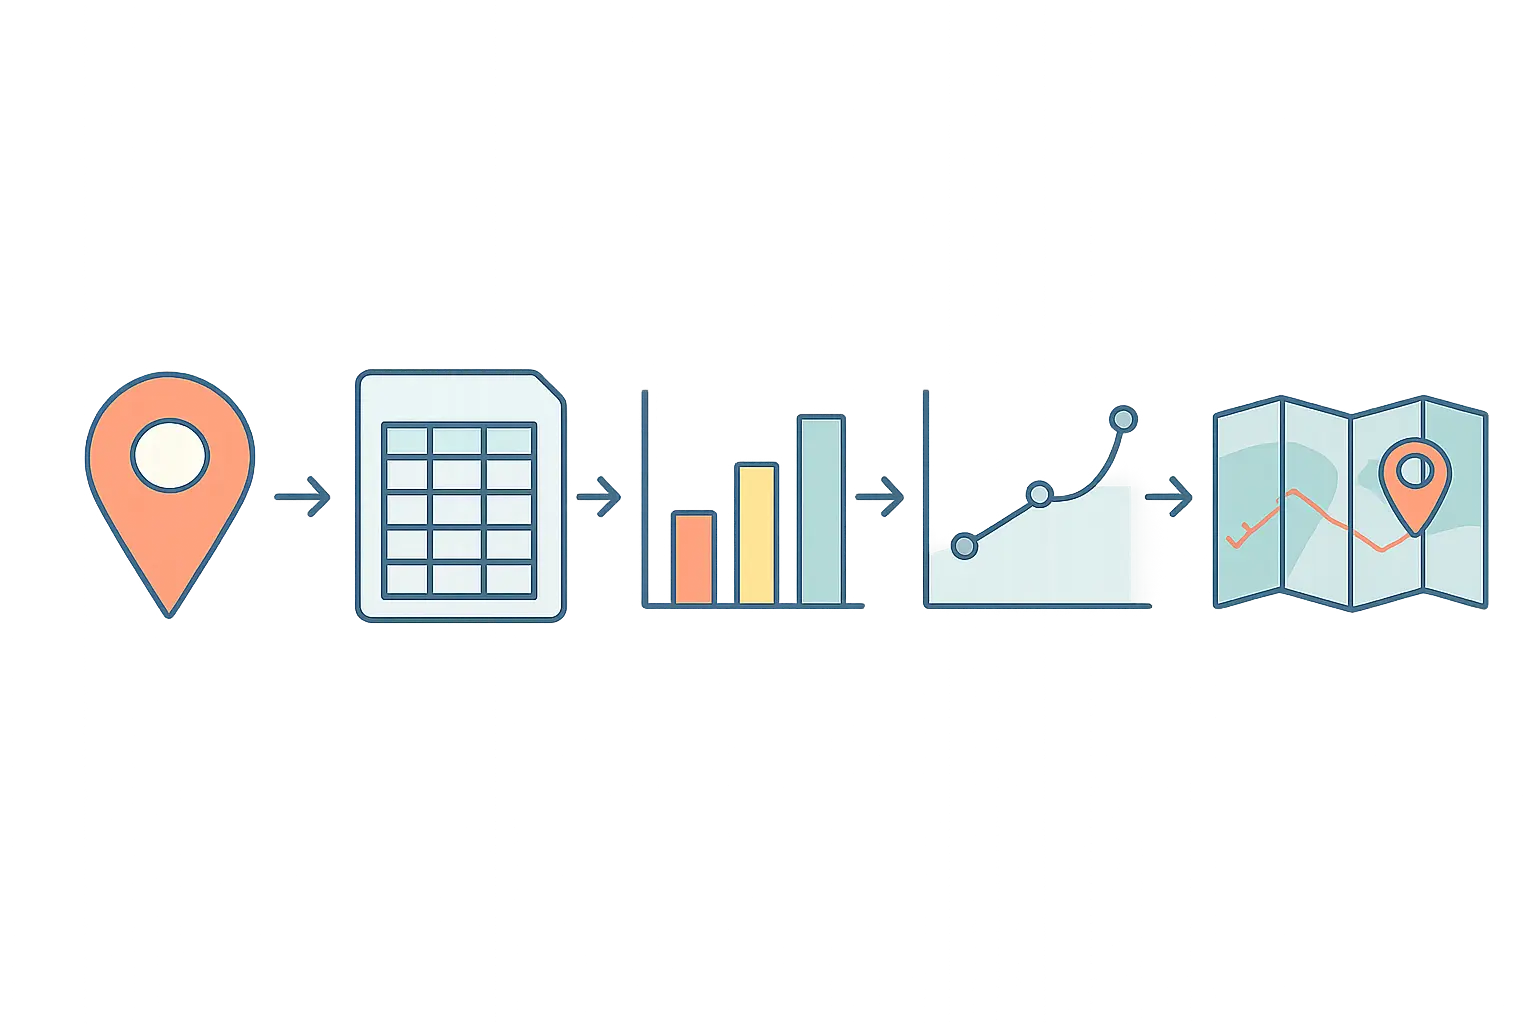
To make the division concrete, consider an illustrative thesis measuring how riparian buffer width affects stream macroinvertebrate diversity across 15 sampling sites:
- Site selection (QGIS): Sites are selected using a buffered-distance layer around the stream network, ensuring even spatial spread and excluding sites within a minimum distance of a wastewater outflow.
- Field data entry (spreadsheet): Raw taxa counts per site, water temperature, and buffer-width measurements are entered into a structured spreadsheet with one row per sample and a data dictionary defining every column.
- Diversity analysis (R, vegan): Shannon diversity indices are calculated per site, and a PERMANOVA tests whether community composition differs significantly by buffer-width category.
- Relationship modelling (R, mgcv): A generalised additive model tests whether the relationship between buffer width and diversity is linear or has a threshold effect, since ecological relationships to a continuous predictor are often non-linear.
- Final maps (QGIS): A publication-quality map showing sampling sites, buffer-width categories and the stream network is produced for the results chapter.
No single tool in this pipeline could replace the others — Excel cannot run a PERMANOVA, R has no native tool for buffered spatial site-selection, and QGIS does not fit generalised additive models. Planning the pipeline against the actual analytical steps, rather than defaulting to one familiar tool, is what prevents a rebuild of the entire analysis midway through the results chapter.
8. Reporting Your Tool Stack in the Methodology Chapter
State the specific software and package versions used for each analytical step, not just “statistical analysis was conducted in R” — a reviewer or future replicator needs to know which package and version ran your mixed model or ordination, since results can shift meaningfully between package versions and even between default settings within the same package. For the surrounding methodology chapter structure — research design justification, sampling and ethics — see our guide on writing a research methodology chapter for your thesis, and for choosing the right statistical test once your data structure is clear, see our guide to statistical tests for an environmental science dissertation. If your data sourcing still needs settling, our directory of free datasets and open data repositories lists the environmental-science-specific sources by name.
Frequently Asked Questions
Should I use QGIS or ArcGIS Pro for my environmental science thesis?
Either is methodologically acceptable for a thesis. Choose ArcGIS Pro if your institution provides a free licence and you want the career-relevant experience many environmental employers expect; choose QGIS if licensing is uncertain or you want a tool you can keep using free after graduation. Neither choice affects what analyses you can demonstrate for the thesis itself.
Can I analyse species count data in Excel?
Not for the inferential analysis. Species count data is typically overdispersed and violates the normal-distribution assumptions behind standard tests; it needs a Poisson or negative-binomial generalised linear model, which requires R (or a dedicated statistics package), not Excel. Excel remains fine for entering and first-checking the raw counts.
Why does repeated water-quality sampling at the same site need a mixed model?
Because repeated measurements taken at the same site are correlated with each other rather than independent, which violates the independence assumption behind a standard t-test or ANOVA. A mixed-effects model (R’s lme4 or nlme) explicitly accounts for the site-level correlation, producing valid standard errors and p-values that a series of independent t-tests would not.
Is jamovi a good alternative to R for an environmental science thesis?
For a straightforward comparison (two groups, a simple regression) jamovi’s free GUI can cover the same ground as R with a gentler learning curve. For community ecology ordination, PERMANOVA, or more complex mixed-effects and generalised additive models, R’s ecological packages (vegan, lme4, mgcv) go well beyond what jamovi currently offers.
Do I need to report software version numbers in my methodology chapter?
Yes, ideally. State the specific software and package versions used for each step (for example, “R version 4.x with the vegan package”) rather than a generic “analysed in R,” since results and default settings can shift between package versions. This is standard reproducibility practice and something a careful examiner may specifically check for.
Write Your Methods Section With Confidence
Tesify’s AI-powered academic writing tool helps environmental science students describe their software stack, statistical procedures and data sources clearly in the methodology chapter — precise enough for a committee, and reproducible enough for a future researcher.
Write your thesis with AI
Structure, draft, cite, and format your thesis faster with Tesify’s AI writing tools, automatic bibliography, and plagiarism checker. Free to start, no credit card required.






Leave a Reply