
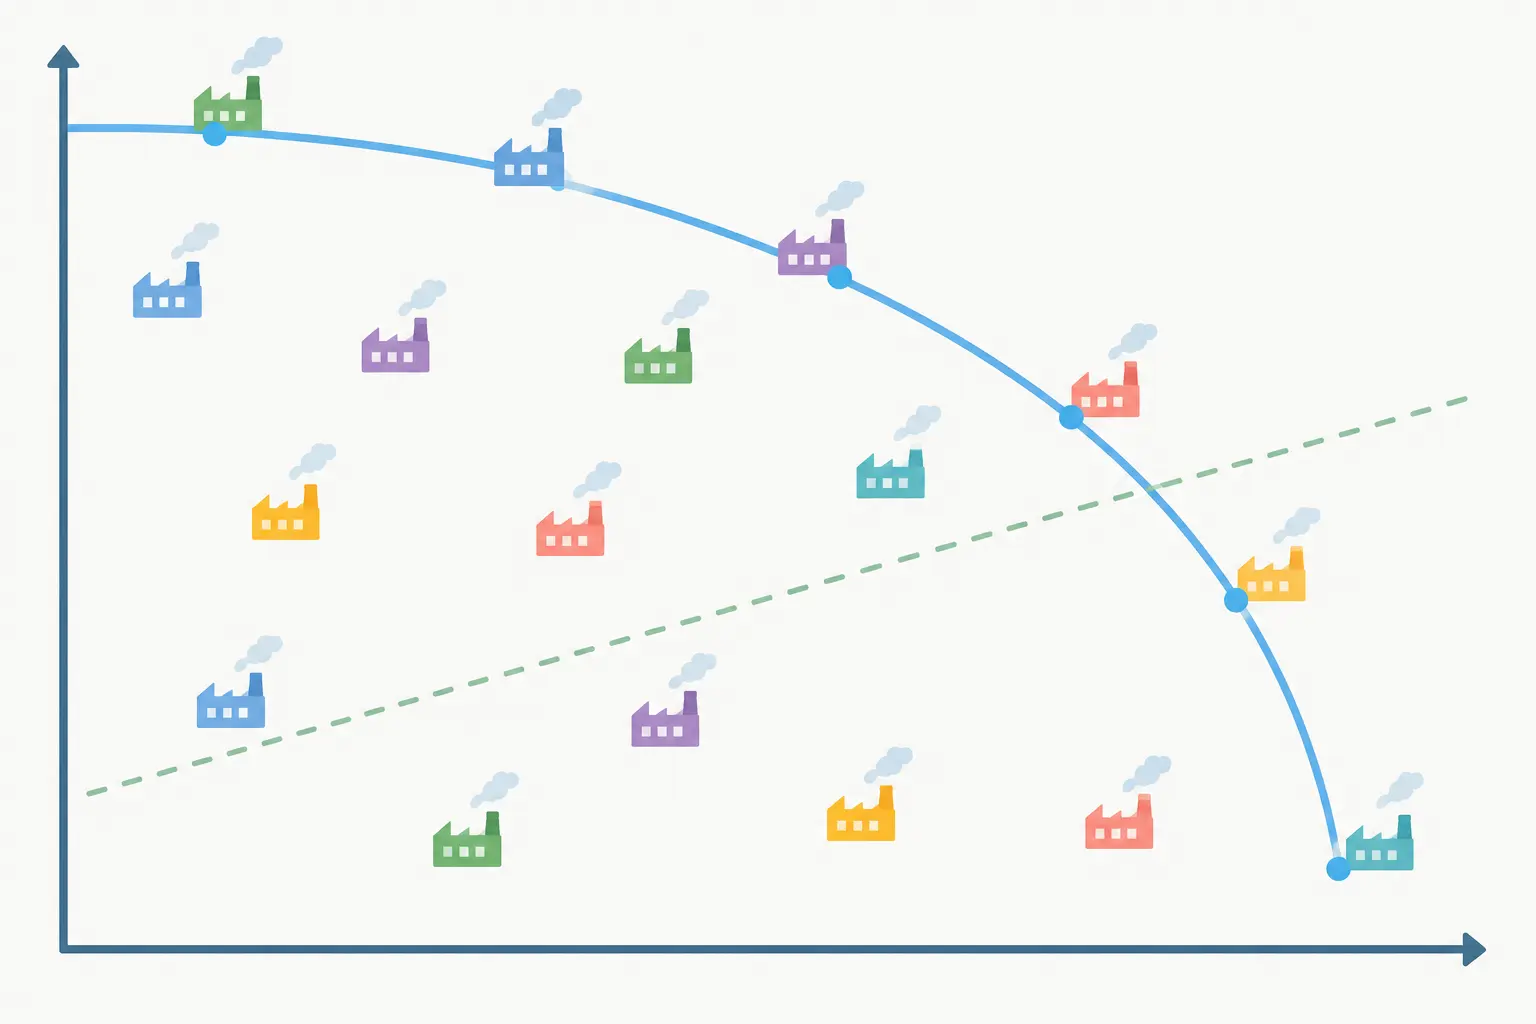
Quick answer: Use Data Envelopment Analysis (DEA) when your question is about relative efficiency across comparable units with multiple inputs and outputs and no obvious “average” relationship to estimate; use regression (or its efficiency-specific cousin, stochastic frontier analysis) when your question is about the strength, direction and statistical significance of a relationship between specific variables, or when you need to separate genuine inefficiency from random noise.
| Dimension | Data Envelopment Analysis (DEA) | Regression (OLS / SFA) |
|---|---|---|
| Functional form | None assumed — non-parametric, built from linear programming | Assumed (linear, log-linear, etc. for OLS; a specified production frontier for SFA) |
| Multiple inputs and outputs | Handles multiple inputs and multiple outputs natively, without needing a single combined index | OLS typically needs a single dependent variable; multiple outputs require a workaround (e.g., an index or separate models) |
| Output | A relative efficiency score (0 to 1, or 0 to 100) per decision-making unit (DMU), plus identified peer benchmarks | Coefficients with standard errors and significance tests; SFA also produces a unit-level efficiency estimate |
| Noise handling | Assumes all deviation from the frontier is inefficiency — no separate error term | OLS models noise as a residual; SFA explicitly separates inefficiency from random noise |
| Statistical inference | Classical DEA has no standard errors or significance tests on the efficiency scores (bootstrapped DEA extensions exist but are less common in student theses) | Full inferential statistics — p-values, confidence intervals, hypothesis tests |
| Sample size sensitivity | Sensitive to the ratio of DMUs to combined inputs/outputs — a common rule of thumb wants at least twice as many DMUs as inputs plus outputs | Standard regression sample-size guidance applies (more observations relative to predictors) |
| Typical software | R packages such as Benchmarking or rDEA, DEAP, Frontier Analyst, or a spreadsheet-based linear-programming solver for small problems |
R, SPSS, Stata, or Python (statsmodels) |
What DEA actually measures

DEA, introduced by Charnes, Cooper and Rhodes in 1978 (the CCR model) and extended by Banker, Charnes and Cooper in 1984 (the BCC model, allowing variable returns to scale), evaluates each decision-making unit’s efficiency relative to the best-performing units in your own sample, not against an external theoretical maximum. It constructs a non-parametric “frontier” from the most efficient observed units and scores every other unit by how far it sits from that frontier, given its own input and output mix. This makes DEA a natural fit for operations management questions where you are comparing similar units — warehouses, hospital units, bank branches, production lines — on multiple, differently scaled performance dimensions at once (cost, throughput, defect rate, on-time delivery) without having to collapse them into one artificial composite index first.
What regression actually measures
A standard regression model estimates the average relationship between a dependent variable and one or more predictors across your sample, and lets you test whether that relationship is statistically distinguishable from zero. Stochastic frontier analysis (SFA), a parametric alternative built specifically for efficiency questions, estimates a production or cost frontier while explicitly modeling two separate error components — genuine inefficiency and ordinary statistical noise — which DEA does not do. Regression is the better choice when your research question is really about a relationship (“does investment in automation reduce unit cost, controlling for plant size?”) rather than about ranking units by overall efficiency.
When to choose DEA
- Your units have multiple inputs and multiple outputs that cannot be sensibly reduced to a single ratio (e.g., labour hours and raw-material cost as inputs; units produced and defect-free rate as outputs).
- You want to identify specific peer units each inefficient unit should benchmark against, not just an average relationship.
- You do not want to assume a specific functional form for how inputs convert to outputs, because you are not confident that assumption holds across your sample.
- Your sample is a set of genuinely comparable units (same industry, similar technology) — DEA efficiency scores are only meaningful relative to units doing fundamentally the same kind of work.
When to choose regression (or SFA)
- Your research question is explicitly about a specific relationship between named variables, and you need to report its statistical significance.
- You are concerned that at least part of the variation in your outcome is genuine random noise (measurement error, a one-off disruption) rather than persistent inefficiency, which argues for SFA over classical DEA.
- You have a single, clear outcome variable (unit cost, output volume) rather than multiple outputs that resist combination.
- Your committee or field expects hypothesis-testing with p-values and confidence intervals rather than a ranked efficiency score.
Common DEA extensions worth knowing about
Beyond the basic CCR and BCC models, a few extensions come up often enough in operations management theses to name explicitly. Super-efficiency DEA lets you rank even the units that scored a perfect 1.0 in a standard model, which is otherwise a common frustration when several “efficient” units are tied. The Malmquist Productivity Index extends DEA across two or more time periods, decomposing productivity change into efficiency change and technological (frontier) change — useful if your thesis question is about improvement over time rather than a single-period snapshot. Weight restrictions or assurance regions let you constrain the linear program so it cannot assign an unrealistic zero weight to an input or output your field considers important, addressing a known criticism that unconstrained DEA can let a unit look efficient simply by ignoring a dimension it performs badly on.
Can you use both in the same thesis?
Yes, and this is a common and well-regarded design: run DEA first to generate an efficiency score for each unit, then use that efficiency score as the dependent variable in a second-stage regression against explanatory variables (firm size, technology adoption, management practices) to explain why some units are more efficient than others. Be explicit in your methods chapter that this is a two-stage design, and be aware of the known statistical critique of naive two-stage DEA-regression designs (the efficiency scores are bounded between 0 and 1 and are not independent of each other, which argues for a Tobit or bootstrapped regression in the second stage rather than plain OLS).
Worked illustrative example

Imagine a thesis comparing the operational efficiency of 30 regional distribution warehouses (illustrative, not a real study). Inputs: labour hours, storage square footage, vehicle-fleet size. Outputs: orders fulfilled, on-time delivery rate. A DEA model (BCC, output-oriented, given the fixed nature of warehouse space and fleet size in the short run) produces an efficiency score for each warehouse and identifies, for each inefficient one, the specific peer warehouses it should be benchmarked against. A second-stage Tobit regression of these efficiency scores on warehouse age, regional demand density and whether the warehouse uses a specific inventory-management system then tests which of these factors is associated with higher efficiency — the question DEA alone cannot answer.
Our recommendation
If your operations management thesis is fundamentally about ranking or benchmarking comparable units on multiple performance dimensions at once, start with DEA. If it is fundamentally about testing a specific causal or associative claim with formal statistical inference, start with regression or SFA. If your question genuinely has both components — which efficiency looks like, and what explains it — the two-stage DEA-then-regression design is the standard, defensible approach, provided you use an estimator suited to a bounded, non-independent dependent variable in the second stage.
Where this fits in your wider methodology chapter
Whichever method you choose, it needs to be justified against your specific research question in the same way any quantitative method choice is — see how to write a business management dissertation for how the methodology chapter as a whole is structured, and which theoretical framework a business or management dissertation should use if you still need to settle on the framework predicting why efficiency should vary across your units before you get to the analysis stage.
Where Tesify fits
Once you have chosen your method and specified your model, Tesify’s thesis workspace, used by 9,000+ students and 15,000+ chapters, helps you structure the methodology section explaining your choice and its assumptions. Every word stays 100% written by you, and Tesify cannot run the DEA linear program or the regression for you. For the software itself, free statistical software for students covers R and other no-cost tools capable of running both DEA (via the Benchmarking or rDEA packages) and standard or Tobit regression, and JASP vs Jamovi vs SPSS vs R compares the mainstream statistics packages if your second-stage regression is the more central part of your analysis.
Frequently asked questions
Do I need advanced mathematics to use DEA in a thesis?
You need to understand the linear-programming logic conceptually, but modern DEA software (R packages, DEAP, Frontier Analyst) handles the optimization itself; a thesis-level treatment focuses on correct input/output selection and interpretation, not on solving the linear program by hand.
How many decision-making units do I need for DEA?
A commonly cited rule of thumb wants the number of DMUs to be at least twice the combined number of inputs and outputs, though more is generally better since DEA is sensitive to sample size and outliers, and a small sample can produce a large share of units scored as artificially “efficient” simply for lack of comparison peers.
Can DEA handle negative or zero values in the data?
Classical DEA models require non-negative input and output values; if your data includes negative values (a net-loss figure, for example) you need a specialized DEA variant or a data transformation, which should be justified and cited explicitly.
Is DEA considered a “real” quantitative method by operations management committees?
Yes — DEA is a well-established, widely published method across operations management, healthcare management, banking and public-sector efficiency research, with a large methodological literature behind it; it is not considered a lesser alternative to regression, simply a different tool for a different question.
What if my outputs are not naturally comparable across units?
DEA does not require outputs to be in the same unit of measurement (orders fulfilled and defect-free rate can coexist in the same model), but every unit in your sample must report all the same inputs and outputs — missing data on even one dimension for one unit typically excludes it from the analysis.
Should I report both DEA and regression results if I only have time for one?
Choose based on your research question, not on running both to “cover bases” — a single well-justified method, correctly matched to your question, is stronger than two methods applied superficially; only combine them, as in the two-stage design above, if your question genuinely needs both an efficiency ranking and an explanation of it.
What is the difference between input-oriented and output-oriented DEA?
Input-oriented DEA asks how much a unit’s inputs could shrink while holding outputs constant to reach the efficient frontier; output-oriented DEA asks how much a unit’s outputs could expand while holding inputs constant. Choose based on which side of the operation your unit realistically controls — a warehouse with a fixed footprint and fleet size fits an output orientation better than an input orientation.
How do I choose which variables count as inputs versus outputs?
Inputs are resources the unit consumes or controls (labour, capital, materials, time); outputs are the results produced from those resources (units produced, services delivered, quality achieved). Get this classification checked against how your specific industry’s operations literature has modeled similar units before finalizing it, since a variable treated as an input in one published DEA study is occasionally treated as a contextual/environmental variable in another.
Can DEA or regression establish that one operational practice causes higher efficiency?
Neither method, used alone on cross-sectional data, establishes causation on its own; a second-stage regression showing an association between a practice and efficiency is suggestive, not proof, and your discussion chapter should say so explicitly unless your design includes some form of exogenous variation (a natural experiment, a staggered rollout) that supports a stronger causal claim.
Write your thesis with AI
Structure, draft, cite, and format your thesis faster with Tesify’s AI writing tools, automatic bibliography, and plagiarism checker. Free to start, no credit card required.





Leave a Reply