Academic Job Market Statistics 2026: Tenure-Track Odds, Postdoc Glut & PhD Outcomes
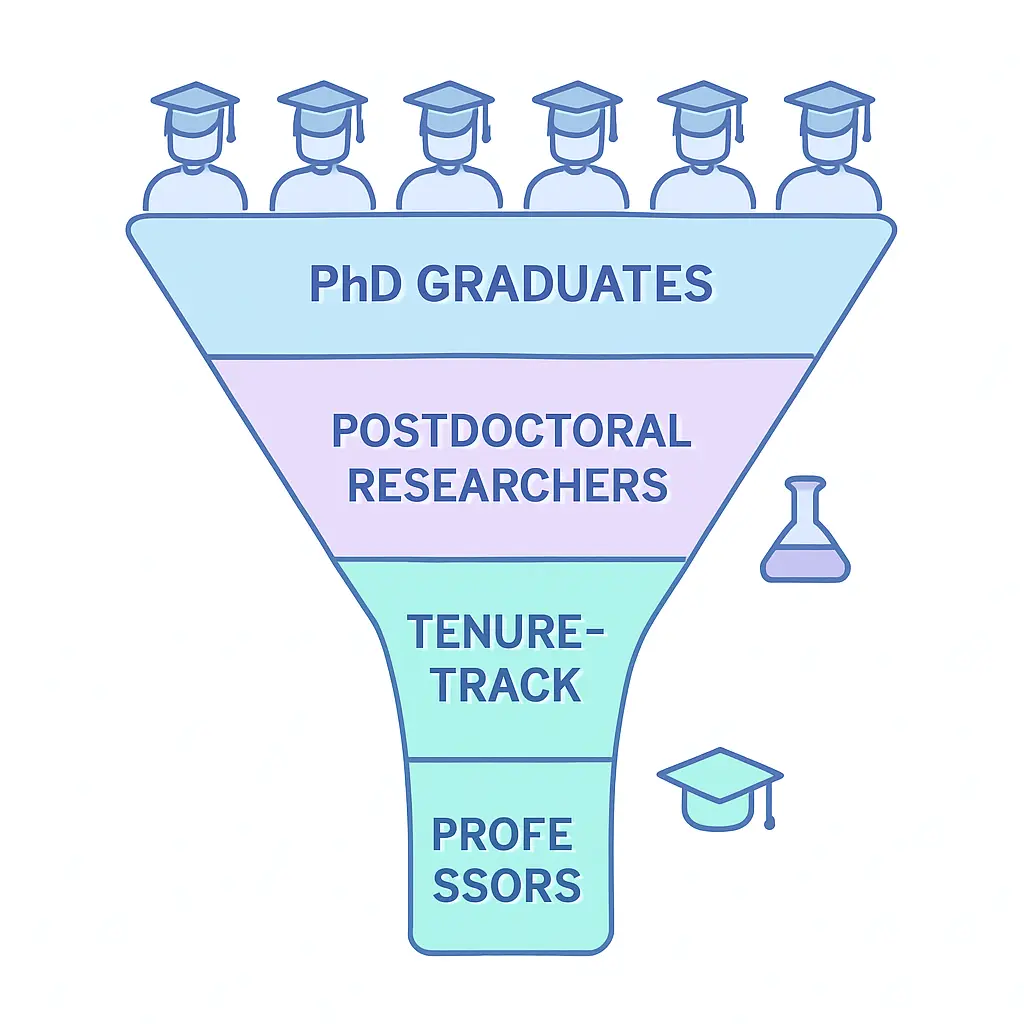
The gap between earning a PhD and securing a permanent academic post has never been wider. Academic job market statistics from 2025–26 confirm what early-career researchers have long suspected: a structural mismatch exists between the number of doctorates awarded each year and the number of tenure-track positions available to fill them. In the United States, the share of faculty holding tenured or tenure-track appointments has fallen from 53% in 1987 to just 32% in 2023, according to the American Association of University Professors (AAUP). In the UK, only around 3.5% of PhD graduates ultimately secure a permanent lectureship, per data cited by the Royal Society.
This data roundup draws on verified sources — NSF, AAUP, HESA, the American Historical Association (AHA), PNAS Nexus, Nature, and Vitae — to give PhD students, postdoctoral researchers, and anyone thinking about an academic career a clear-eyed view of the odds. The picture varies significantly by field, country, and career stage, and understanding the real numbers is the first step toward making informed decisions about your path.
Only about 12–14% of STEM PhDs in the US reach a tenure-track faculty position within 5–6 years of graduation. In the humanities, fewer than 213 new tenure-track history positions were listed in the US in 2024–25 — the lowest since the pandemic. Meanwhile, 68% of all US faculty are now in contingent (non-tenure-track) roles, and more than 40% of postdoctoral researchers leave academia altogether. The UK picture is similarly constrained: 29% of academic staff remain on fixed-term contracts as of 2024/25.
Key Findings at a Glance
- 68% of US faculty held contingent appointments in fall 2023, up from 47% in 1987 (AAUP, 2025).
- Full-time tenure-track appointments in the US decreased approximately 7% from 2002 to 2023 in absolute numbers, even as total faculty headcounts grew (AAUP, 2025).
- Only 34% of US science and engineering (S&E) doctorate recipients with definite non-postdoc employment commitments reported academia as their principal employer in 2023 — down from 54% in 2003 (NSF SED 2023).
- 36% of S&E doctorate recipients with definite US employment plans in 2023 entered postdoctoral positions rather than permanent roles (NSF SED 2023).
- The average likelihood of an engineering PhD securing a tenure-track faculty role in the US between 2006 and 2021 was 12.4% — roughly 1 in 8 (PNAS Nexus, 2024).
- For the life sciences specifically, only an estimated 14% of biological sciences PhDs hold a tenure-track position 5–6 years after graduation (PNAS Nexus analysis of NSF/ASEE data).
- More than 40% of postdoctoral researchers ultimately leave academia entirely, per a study of approximately 45,500 researcher career trajectories (Nature, 2025).
- In 2024–25, only 213 tenure-track history positions were listed in the US — a 20% fall from the prior year and the lowest since the pandemic (AHA, 2025).
- In the UK, 29% of academic staff were on fixed-term contracts as of December 2024, with research-only staff disproportionately affected (HESA, 2026).
- In the UK, only 42% of doctoral graduates work in academia 15 months after graduation; 23% are in fixed-term postdoctoral roles (Vitae, 2026).
US Tenure-Track Statistics: The Shrinking Permanent Core
The transformation of the US academic workforce over the past four decades is one of the most significant structural shifts in higher education. The AAUP’s Data Snapshot: Tenure and Contingency in US Higher Education, Fall 2023 — published in spring 2025 — provides the most recent national picture.
In fall 2023, approximately 32% of all US faculty held full-time tenured or tenure-track appointments. In fall 1987, that share was 53%. Full-time contingent appointments (i.e., non-tenure-track but full-time) grew approximately 65% from 2002 to 2023, while nearly half of all faculty (49%) were employed part-time — compared with 33% in 1987. At associate’s colleges (community colleges), contingent faculty account for around 83% of all appointments, while even at Research I universities the figure sits at approximately 51%.
Video: An evidence-based analysis of whether tenure-track academic positions are declining and what this means for PhD graduates. Source: R3ciprocity — Prof. David Maslach on YouTube.
This shift has direct implications for the academic job market. Hiring institutions are increasingly filling teaching and research needs through a combination of adjunct appointments, visiting positions, and postdoctoral fellowships rather than through tenure-track searches. Fewer permanent openings are created despite steady or growing enrolment in many fields.
The NSF Survey of Earned Doctorates 2023 adds depth to the employment-commitment picture. Of the 57,862 research doctorates awarded in the US in the 2022–23 academic year, approximately 74% of S&E recipients had definite commitments for employment or postdoctoral training by graduation. Of those with non-postdoc employment commitments in the US:
| Sector | Share (%) | Approximate Number | 2003 Share (%) |
|---|---|---|---|
| Industry / Business | 47% | 10,495 | ~30% |
| Academia | 34% | 7,672 | 54% |
| Government | 7% | 1,535 | ~9% |
| Nonprofits | 7% | 1,462 | ~7% |
| Other / Not reported | 6% | 1,298 | — |
| Source: NSF NCSES, Doctorate Recipients from U.S. Universities: 2023 (NSF 25-300) | |||
The 20-percentage-point drop in academic employment commitments — from 54% in 2003 to 34% in 2023 — is the most dramatic trend in this dataset. Mathematics and statistics experienced the steepest relative fall (from roughly 70% to just 27%), while engineering has consistently shown the lowest academic placement rate, now below 10% for non-postdoc commitments.
The American Association of University Professors publishes annual data visualisations on the growth of contingent (non-tenure-track) faculty appointments across all US institution types. Their interactive data portal breaks down figures by Carnegie Classification, contract type, and time series from 1987 to the present.
STEM PhD-to-Faculty Conversion Rates by Field
The conversion rate from PhD graduation to tenure-track faculty appointment varies substantially by discipline. A 2024 study published in PNAS Nexus analysed data from the American Society for Engineering Education (ASEE) covering all US engineering subdisciplines from 2006 to 2021. The headline finding: the average probability of an engineering PhD securing a tenure-track position during this period was 12.4%. That figure peaked at 18.5% in 2006, fell to a low of 10.9% in 2014, and has since recovered only modestly to the 11–12% range.
Across the broader STEM pipeline, NSF and ASEE data analysed in multiple peer-reviewed studies reveal the following approximate tenure-track attainment rates 5–6 years post-graduation:
- Biological and biomedical sciences: approximately 14% reach tenure-track positions. These fields also have the highest postdoc uptake: 58% of bio/biomedical doctorate recipients entered postdoc positions in 2023 (NSF SED 2023).
- Chemistry: approximately 23%, benefiting from a broader range of R1 chemistry departments hiring, though postdoc periods of 4–6 years are now standard.
- Engineering: approximately 12.4% overall, with the lowest rates in biomedical engineering and petroleum engineering subdisciplines.
- Physical sciences (physics, astronomy): approximately 11–15%; geosciences show a postdoc uptake rate of 64% in 2023, indicating a long pre-tenure-track queue in earth and climate fields.
- Computer science: a notable exception — industry demand has reshaped the pipeline, with fewer than 10% of CS PhDs targeting academia and industry offering substantially higher compensation.
A critical nuance from the PNAS Nexus study: completing a postdoc does not on average increase the probability of landing any tenure-track position — it does, however, increase the probability of landing one at an R1 (research-intensive) university specifically. Among postdoctoral researchers who do transition to academic roles, 51.2% of those tenure-track transitions are at R1 institutions. The implication: postdoc years select for research prestige, not simply access to a permanent position.
Median time from PhD completion to a first tenure-track appointment — across fields — is approximately 6 years, with a further 5–7 years typically required before tenure itself is awarded, per data from a neuroscience faculty study. Total time from PhD to tenure can therefore run to 11–13 years, a consideration with profound implications for career planning. See also the related data on stipend pressures during this extended training period: graduate stipend statistics show a widening cost-of-living gap that compounds the financial pressure of extended pre-tenure careers.
Humanities & Social Sciences: The History Job Market in Numbers
The humanities job market operates on a different scale and with different dynamics to STEM fields. The American Historical Association’s 2025 Academic Jobs Report provides the most recent comprehensive data for history — one of the best-documented humanities disciplines.
In the 2024–25 academic year, 425 positions were listed in the AHA Career Center in total. Of those, only 213 were tenured or tenure-track posts — a 20% decline from the prior year and the lowest total since the pandemic. The report notes that total history faculty (all types) at two- and four-year US institutions declined 16% from 2015 to 2024, per Bureau of Labor Statistics estimates, and full-time faculty tracked through the AHA’s Directory of History Departments fell 13% from 2010 to 2025.
| Academic Year | Total AHA Listings | Tenure-Track Listings | Notes |
|---|---|---|---|
| 2021–22 | ~350 | 266 | Post-pandemic partial recovery |
| 2023–24 | ~506 | ~266 | Near-recent average |
| 2024–25 | 425 | 213 | –16% total; –20% TT; lowest since COVID |
| Source: American Historical Association, 2025 Academic Jobs Report | |||
The report also documents specialisation-level shifts. US history positions rose from 22% to 39% of all tenure-track listings between 2021–22 and 2024–25, suggesting hiring committees are increasingly favouring domestic over global or comparative expertise. The Midwest saw a 28% decline in history faculty from 2015 to 2024 — the sharpest regional contraction. The AHA report contextualises this within a broader pattern: history faculty numbers peaked in 2008 and have never returned to that level following the Great Recession.
For philosophy, sociology, and modern languages — disciplines that track closely with history in hiring patterns — the picture is similarly constrained, though less comprehensively documented at a national level. Understanding attrition within PhD programmes is equally important context: for a closer look at how many students make it through the doctorate itself, the data is covered in detail in the PhD dropout rates statistics roundup.
The Postdoc Pipeline: Duration, Conversion & Attrition
Postdoctoral research positions were designed as a brief transitional stage — a one- to three-year period to develop an independent research profile before moving to faculty. The data suggest this is no longer how the pipeline functions in practice.
The median duration of postdoctoral training in STEM fields now stands at approximately 4.6 years, per analysis in PLOS One. A significant proportion — 7% of postdocs — spend more than seven years in postdoctoral roles before either securing a faculty position or leaving academia. In the NSF SED 2023, the highest postdoc uptake rates were in geosciences (64%), biological and biomedical sciences (58%), and physical sciences (47%).
The most striking data on postdoc career outcomes comes from a large-scale longitudinal study tracking approximately 45,500 researcher careers, reported by Nature in 2025: more than 40% of postdoctoral researchers ultimately leave academia. Of those who remain, only a subset reach permanent faculty posts. The PLOS One analysis of STEM cohorts from 2000 to 2013 found that less than one-quarter of life-science postdocs transitioned to tenure-track positions within 5–6 years of graduation, and only one-third of physical science and engineering postdocs did the same.
Pay and job security remain the primary drivers of attrition. A 2023 Nature analysis on postdoc working conditions — “Postdocs are pushing back against low pay and conditions” — found that postdoctoral dissatisfaction about salary, career progression, and job insecurity has reached a level that risks a generation-level talent drain from research universities.
UK & European Academic Labour Market Data
The UK higher education system presents its own version of the postdoc bottleneck, with HESA data providing the most granular annual picture.
As of 1 December 2024 (the HESA 2024/25 census date), 244,755 academic staff were employed at UK higher education providers — a slight fall, marking the first annual decline in total academic headcount in recent years. Of these:
- 29% (approximately 70,980) were on fixed-term contracts. Among part-time academics, 43% were on fixed-term contracts.
- 21% of all academic staff were in research-only roles — a category that encompasses the majority of postdoctoral researchers and is disproportionately casualised.
- 43% of academic staff worked in combined teaching-and-research roles; 35% were teaching-only.
The Royal Society’s oft-cited Scientific Century (2010) pipeline diagram estimated that roughly 200 PhD students enter the biomedical research pipeline for every one who eventually becomes a professor — a ratio of 200:1 that has, if anything, worsened since then as PhD student intakes have grown while permanent faculty posts have not expanded proportionally. The figure of approximately 3.5% of UK PhD graduates securing permanent lectureships is widely cited in UK academic career guidance as a rough system-wide estimate.
The UCU (University and College Union) and Advance HE surveys consistently show high levels of fixed-term contract use in STEM departments, while a significant proportion of academic staff — particularly those in teaching-intensive universities — are now on zero-hours or fractional contracts. HESA’s 2026 release of 2024/25 data notes that the fall in total academic headcount was driven primarily by reductions in research-only staff, suggesting that postdoctoral positions are where the adjustment pressure is being felt first.
For broader international context on how country-level systems shape doctoral outcomes, see the higher education statistics and trends 2026 roundup, which covers global enrolment, graduation rates, and policy shifts across the US, UK, EU, and Australia.
Where Do PhD Graduates Actually Go?
Given that the majority of PhD graduates do not reach tenure-track positions, understanding non-academic career pathways is increasingly important. Two datasets provide the best available picture — one for the UK and one for the US.
UK (Vitae, 2026): A Vitae analysis of 10,690 PhD graduates from the 2022–23 cohort, surveyed 15 months after graduation, found that 91% were in employment, with fewer than 3% unemployed and a median salary of £42,000. Of those working, only 42% were based in academia — and within that academic group, 23% were in fixed-term postdoctoral research posts rather than permanent or tenure-track roles. The remaining 16% held university teaching positions and 3% had other academic roles. Non-academic destinations included healthcare (14.5%), and engineering, construction, and R&D (12%).
US (NSF SED 2023): Of all 57,862 US research doctorates awarded in 2022–23, 74% of S&E recipients had definite employment or postdoc commitments at graduation. The dominant non-academic destination was industry and business, which absorbed 47% of those with direct employment commitments — a figure that has more than doubled as a share since 2003, driven heavily by technology sector demand for STEM PhDs.
These figures align with broader shifts visible in graduate employability data: PhD holders consistently outperform bachelor’s and master’s graduates on employment rates and lifetime earnings, but the specific pathway to those outcomes is increasingly non-academic. The data also links tightly to the question of who chooses not to finish at all: for context on where attrition happens within doctoral programmes themselves, see the PhD dropout rates by country 2026 dataset.
Summary Table: Key Academic Job Market Statistics by Field and Country
| Metric | Value | Field / Country | Source |
|---|---|---|---|
| Share of US faculty in contingent roles | 68% | All disciplines, US | AAUP 2025 |
| S&E PhDs entering postdoc in 2023 | 36% | All S&E, US | NSF SED 2023 |
| Bio/biomedical PhDs entering postdoc | 58% | Life sciences, US | NSF SED 2023 |
| Engineering PhD tenure-track probability | 12.4% | Engineering, US (2006–21) | PNAS Nexus 2024 |
| Biology PhD tenure-track probability | ~14% | Life sciences, US | PNAS Nexus / NSF analysis |
| Postdocs leaving academia | >40% | All fields (n ≈ 45,500) | Nature 2025 |
| Median postdoc duration | 4.6 years | STEM, US | PLOS One 2023 |
| History tenure-track listings, 2024–25 | 213 | History, US | AHA 2025 |
| UK academics on fixed-term contracts | 29% | All disciplines, UK | HESA 2026 |
| UK PhD graduates in academia 15 months post-graduation | 42% | All disciplines, UK | Vitae 2026 |
| US S&E PhDs with academic non-postdoc jobs | 34% | All S&E, US | NSF SED 2023 |
| Sources: AAUP 2025, NSF SED 2023, PNAS Nexus 2024, AHA 2025, HESA 2026, Vitae 2026, Nature 2025, PLOS One 2023 | |||
Frequently Asked Questions
What percentage of PhDs get a tenure-track job in the US?
Across STEM fields, approximately 12–14% of PhD graduates secure a tenure-track faculty position within 5–6 years of graduation. The PNAS Nexus 2024 study puts the engineering average at 12.4% over the period 2006–2021. In the life sciences, the figure is closer to 14%. In the humanities, the absolute number of tenure-track openings is so small (213 history positions in 2024–25, per the AHA) that the ratio of PhDs awarded to positions available runs well into double figures for applicants per post.
How many US faculty positions are tenure-track vs contingent?
As of fall 2023, approximately 32% of US faculty held full-time tenured or tenure-track appointments, down from 53% in 1987. Around 68% of all faculty were in contingent roles — including full-time non-tenure-track, part-time adjunct, and visiting positions. At community colleges, the contingent share reaches around 83%; even at Research I universities it stands at roughly 51% (AAUP, 2025).
How long does it take to get a tenure-track job after a PhD?
The median duration from PhD completion to a first tenure-track appointment is approximately 6 years, with the majority of that time spent in one or more postdoctoral positions. The median postdoc duration itself is now approximately 4.6 years (PLOS One, 2023). Adding the subsequent 5–7 years typically required to earn tenure, the total elapsed time from PhD to tenure commonly reaches 11–13 years in STEM fields.
What percentage of postdocs leave academia?
More than 40% of postdoctoral researchers ultimately leave academia, according to a large-scale study of approximately 45,500 researcher careers reported by Nature in 2025. Among those who leave, the most common destinations include industry, government research agencies, and — increasingly — technology-sector roles in data science, research management, and product development.
Are history PhD jobs getting worse?
The data suggest yes — the 2024–25 AHA Academic Jobs Report recorded only 213 tenure-track history positions in the US, a 20% decline from the prior year. The total number of history faculty at US institutions fell 16% from 2015 to 2024, and full-time history faculty are down 13% from their 2010 peak. The Midwest has seen the sharpest regional contraction at 28%. These trends have persisted since the Great Recession and show no sign of structural reversal.
How many UK academics are on fixed-term contracts?
As of December 2024, 29% of all academic staff at UK higher education providers were employed on fixed-term contracts — equivalent to approximately 70,980 individuals. Among part-time academic staff the rate rises to 43%. Research-only staff (who constitute 21% of all UK academics and include the majority of postdoctoral researchers) are disproportionately affected, as fixed-term project-based funding underpins most research-only appointments (HESA, 2026).
What do PhD graduates do if they don’t go into academia?
In the UK, Vitae’s 2026 analysis of 2022–23 doctoral graduates found that 91% were employed 15 months post-graduation, with a median salary of £42,000. Non-academic destinations included healthcare (14.5%), engineering and R&D (12%), and professional services. In the US, industry and business absorbed 47% of S&E doctorate recipients with direct employment commitments in 2023 — up sharply from around 30% in 2003 — driven primarily by technology sector demand for data science, AI, and biotech skills (NSF SED 2023).
Does doing a postdoc increase your chances of getting a tenure-track job?
The research is nuanced. On average, doing a postdoc does not increase the probability of landing any tenure-track position compared with going directly from PhD to the job market. However, it does increase the probability of landing a tenure-track role at a Research I (R1) university specifically — 51.2% of postdoc-to-faculty transitions are at R1 institutions. This means postdoctoral training acts primarily as a sorting mechanism for prestige tier rather than a gateway to permanent academic employment per se (PNAS Nexus, 2024).
Which STEM field has the best academic job market odds?
Chemistry has one of the higher tenure-track attainment rates among STEM fields at approximately 23% within 5–6 years post-graduation, compared with 14% for biology and 12.4% for engineering. Physical sciences sit in the 11–15% range. Computer science is a special case: relatively few CS PhDs pursue academic careers, but industry demand is strong enough that total employment outcomes for CS doctoral graduates are among the highest of any field. Biomedical engineering, petroleum engineering, and nuclear engineering are among the lowest within engineering (PNAS Nexus, 2024).
How has the academic job market changed since 2003?
The shift has been dramatic and consistent. In the US, the share of S&E doctorate recipients entering academia (in non-postdoc roles) fell from 54% in 2003 to 34% in 2023 (NSF SED). Mathematics and statistics experienced the steepest decline — from roughly 70% to 27%. Meanwhile, the share of all faculty in contingent roles rose from 47% in 1987 to 68% in 2023 (AAUP), and full-time tenure-track appointments fell approximately 7% in absolute terms between 2002 and 2023 despite total enrolment growth.
Preparing for the Academic Labour Market
Whether your goal is a tenure-track role or a career beyond academia, the evidence points in the same direction: the more thoroughly you document, structure, and communicate your doctoral research, the stronger your position — in any hiring context. Tesify helps PhD students organise their thesis structure, manage citations, and develop the clear academic writing that underpins both job applications and published outputs. If your research is well-documented and compellingly framed, it works for you whether your next step is a postdoc application, a faculty cover letter, or a pitch to an industry employer.
For a fuller picture of what doctoral graduates earn and how their outcomes vary by field, see the graduate employability statistics 2026 data roundup.
Write your thesis with AI
Structure, draft, cite, and format your thesis faster with Tesify’s AI writing tools, automatic bibliography, and plagiarism checker. Free to start, no credit card required.


Leave a Reply