
How to Build a Realistic Thesis Timeline With a Gantt Chart, Step by Step (2026)
Knowing how to make a thesis timeline is the difference between a project that drifts indefinitely and one that reaches the submission portal on schedule. Most students underestimate two things: how long individual milestones actually take, and how many unexpected delays — ethics board decisions, supervisor unavailability, participant recruitment problems — will arrive uninvited. A Gantt chart forces you to commit to dates, visualise overlapping tasks, and detect slippage the moment it begins rather than three months after it started.
This guide walks through every step: breaking your thesis into milestones, estimating realistic durations, adding deliberate buffers, building the chart in Excel, Notion, or GanttProject, and recovering from schedule slippage without panic. By the end you will have a working timeline you can update every week throughout your research.
Step 1: Set Your Hard Deadline and Work Backwards
Before you open a spreadsheet, identify the single most important date in your thesis project: the final submission deadline set by your institution or funding body. Write it on paper and pin it somewhere visible. Everything else is built backwards from that anchor.
Working backwards — sometimes called backcasting — reveals the chain of events you must complete to hit the deadline. If your institution requires four weeks for internal binding and library processing, your real completion deadline is four weeks before the portal closes. If your supervisor typically takes two to three weeks to return feedback on a full chapter, that time must appear on your chart before every writing phase. Strip away administrative lead times first, and you will already have a more accurate picture of the working months genuinely available to you.
A useful first question: how many weeks remain between today and your adjusted completion deadline? Write that number down. It is the total number of columns your Gantt chart will need.
Step 2: Break the Thesis Into Major Milestones
A milestone is any deliverable or decision point that must happen before the next phase can begin. For most postgraduate theses, the standard milestones are:
- Topic finalisation and supervisor sign-off
- Research proposal or registration document
- Ethics approval (IRB / REC application and outcome)
- Literature review (search, screening, synthesis, and write-up)
- Research design and methodology chapter
- Instrument creation (survey, interview guide, or lab protocol)
- Pilot study or feasibility test
- Data collection
- Data analysis
- Results chapter
- Discussion and conclusion chapters
- Introduction and abstract (typically written last)
- Supervisor review rounds — allow at least two full cycles
- Professional proofreading or copy-editing
- Formatting, bibliography check, and final submission
Not every thesis uses every milestone. A purely theoretical dissertation skips data collection. A systematic review replaces primary data collection with a structured database search protocol. Adjust the list to match your study design. Our step-by-step guide on how to write a dissertation methodology chapter explains how to choose and justify your research design — a decision that directly determines which milestones your timeline needs to include.
Step 3: Estimate Durations Honestly
This is where most students go wrong. First-draft estimates are almost always optimistic. A practical correction: take your initial estimate for any milestone and add 30–50% to account for feedback cycles, re-reads, and the days when life intervenes. Below is a sample timeline for a twelve-month master’s thesis. These figures are illustrative — your institution’s ethics process, your research design, and your writing pace will shift them considerably.
| Milestone | Start (wk) | Duration (wks) | Buffer (wks) | End (wk) |
|---|---|---|---|---|
| Topic finalisation | 1 | 2 | 1 | 4 |
| Ethics approval | 3 | 5 | 3 | 11 |
| Literature review | 3 | 9 | 2 | 14 |
| Research design & methodology | 8 | 4 | 1 | 13 |
| Instrument design & pilot | 12 | 3 | 1 | 16 |
| Data collection | 16 | 6 | 2 | 24 |
| Data analysis | 24 | 5 | 2 | 31 |
| Results & discussion chapters | 30 | 8 | 2 | 40 |
| Introduction & abstract | 39 | 2 | 1 | 42 |
| Supervisor review rounds (×2) | 38 | 6 | 2 | 46 |
| Final editing & formatting | 46 | 2 | 1 | 49 |
| Submission | 50 | — | 3 | 52 |
Notice how the literature review and ethics approval run in parallel from week 3 onward. Overlapping phases are normal and desirable — but they show up clearly only when you draw them as bars. A linear to-do list hides this parallelism entirely, which is why a Gantt chart matters.
The literature review is consistently the most underestimated milestone. See our guide on how to do a literature review for your thesis for a realistic breakdown of the search, screening, synthesis, and write-up sub-tasks you should account for when filling in that row of your chart.

Step 4: Build Your Gantt Chart (Excel, Notion, or GanttProject)
You do not need specialist software. Three tools cover the full range of student needs, from zero cost to collaborative cloud editing.
Option A: Microsoft Excel or Google Sheets (free, universal)
- Create a table with four columns: Task | Start week | Duration (weeks) | End week.
- Select the data range and insert a Stacked Bar chart.
- Click the “Start week” series bar, open Format Data Series, and set the fill to No Fill. This makes the first segment invisible, leaving only the task duration bar visible — the essential Gantt trick.
- Right-click the vertical (task) axis, choose Format Axis, and tick Categories in reverse order so task 1 appears at the top.
- Replace the horizontal axis numbers with calendar dates by setting the minimum value to the week-number equivalent of your start date.
- Colour-code bars by phase: literature work in blue, data collection in amber, writing phases in green, review rounds in grey.
The result is a clean, printable Gantt chart you can export to PDF and paste directly into your research proposal. Ethics committees and funding panels routinely ask for exactly this format. The tesify.pro guide on how to write a research proposal step by step covers how to embed and contextualise your timeline within the proposal document itself.
Option B: Notion (collaborative, cloud-synced)
- Create a new database and switch to Timeline view from the view selector.
- Add properties: Status (Not started / In progress / Done), Phase (Literature / Data / Writing), and a Notes field for supervisor comments.
- Set start date and end date properties on each task; Notion renders the Gantt bars automatically between those two dates.
- Use Group by Phase to colour-code rows by research stage.
- Share the view link with your supervisor so they can leave comments directly on individual task cards rather than sending email threads.
Option C: GanttProject (offline, free, purpose-built)
GanttProject is a free open-source desktop application available for Windows, Mac, and Linux. Import your milestone list as a CSV, assign task dependencies with drag-and-drop dependency arrows, and export a publication-quality PDF or PNG. The built-in resource chart reveals weeks where you are overloaded across tasks — particularly useful if you are writing up while teaching, working part-time, or sitting qualifying exams simultaneously.
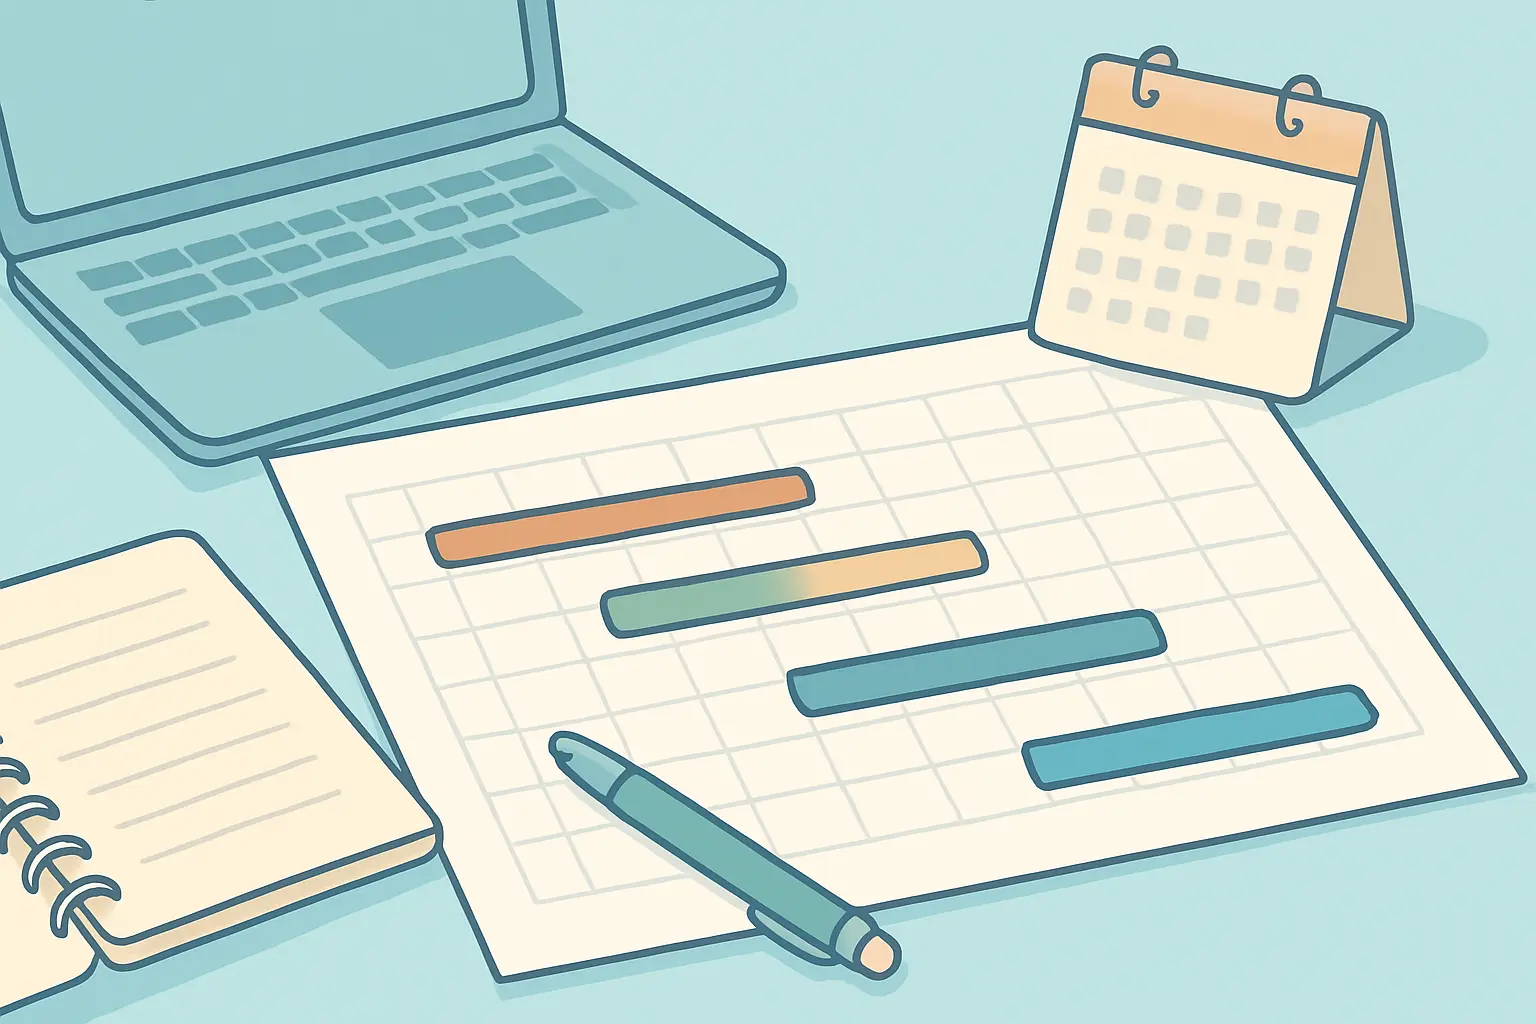
Whichever tool you choose, the principle is identical: each task is a horizontal bar, its length represents duration, and its position on the timeline shows when it runs relative to every other task. The chart is not a decoration — it is your weekly reference document.
Step 5: Add Buffers and Map Dependencies
A buffer is empty time allocated to a task beyond your best-case estimate. Buffers are not padding to make yourself feel better — they are insurance against delays you cannot predict. Ethics boards routinely take longer than their stated turnaround time. Supervisors go on conference leave or sabbatical. Participant recruitment stalls when your target population turns out to be harder to reach than expected.
A practical buffer rule for thesis timelines: add 25–30% extra time to any phase that depends on a third party (ethics board, supervisor, research participants, archive or library access). Add 15–20% to solo writing and analysis phases, where the main risk is your own underestimation of how long a chapter will take. Do not add meaningful buffer to straightforward administrative tasks like reformatting your reference list — those take a predictable few hours.
Dependencies determine the order tasks must run. In project management, a finish-to-start dependency means Task B cannot begin until Task A is complete. On your Gantt chart, draw an arrow from the end of the first bar to the start of the next for any hard dependency. Common thesis dependencies include:
- Ethics approval must be granted before participant recruitment begins.
- Data collection must close before full statistical analysis can start.
- A complete chapter draft must exist before supervisor review can happen.
- All chapters must be individually approved before final whole-thesis review.
Once you map dependencies, you will often discover that a delay in one early milestone cascades through every task downstream — this is called your critical path. The critical path is the longest sequence of dependent tasks, and it determines the earliest possible submission date. Placing your largest buffers on critical-path tasks is the single most effective planning decision you can make.

Step 6: Track Progress and Manage Slippage
A Gantt chart built once and never updated is nearly useless. Book a fifteen-minute weekly review session — Friday afternoons work well for most students — where you update the chart against what you actually completed that week.
The weekly review routine
- Mark completed tasks. Move the end date of any finished task to today’s date, or tick a Done checkbox if you are using Notion.
- Flag tasks running late. If a task was due to end this week but is still in progress, extend its bar by the number of days you realistically need to finish it.
- Propagate the impact. If an extended task now overlaps with a downstream task’s planned start date, shift that downstream bar forward too. Never leave gaps in the chart that imply fictional recovery time.
- Check your submission date. Has the accumulated delay pushed your final submission past your deadline? If yes, you have three levers: reduce scope, compress a writing phase, or negotiate a formal extension.
- Send your supervisor a one-line status update. “Ethics decision delayed by ten days; updated timeline attached.” Supervisors respond far better to early, proactive notification than to silence followed by a last-minute crisis conversation.
When slippage becomes serious
Slippage of one to two weeks is normal and recoverable through your pre-built buffers — this is exactly what they exist for. Slippage of more than four weeks on a critical-path task requires a deliberate structural response. Ask yourself: can any tasks that were originally sequential now run in parallel? Can a planned chapter be shortened without harming the core argument? Can one wave of data collection be trimmed without compromising validity?
If you are working on a PhD, our guide to how to structure a PhD thesis step by step includes advice on which elements can be reorganised or deprioritised at different stages of a multi-year project — useful context when you are weighing up scope reduction against an extension request.
For a complete overview of the dissertation process from research question to final submission, including chapter sequencing and supervisor management advice throughout the project, see our guide on how to write a dissertation in 2026.
Keep your thesis on track with Tesify
Tesify’s AI writing assistant helps you draft chapters, structure your argument, and build your bibliography — so writing never becomes the bottleneck that derails your timeline. Start your thesis with Tesify →
Frequently Asked Questions
How long should a thesis timeline be?
A thesis timeline should span from your current date to your submission deadline — typically six to twelve months for a master’s thesis and two to four years for a PhD. Plan at week-level granularity rather than day-level, grouping tasks into two-to-four week blocks. A chart that is too granular becomes impossible to maintain; one that is too coarse hides early warning signs of slippage before they become crises.
What is the best free tool to build a thesis Gantt chart?
Google Sheets (using a stacked bar chart with the start-date series hidden) is the most accessible option — no installation required, easily shared with supervisors, and exportable to PDF. For more visual control and dependency arrows, GanttProject (free desktop software for Windows, Mac, and Linux) is purpose-built for this kind of planning. Notion’s Timeline view is the best choice if you already manage your notes and tasks in Notion and want everything consolidated in one workspace.
How much buffer time should I add to each thesis milestone?
Add 25–30% extra time to any phase that depends on a third party — ethics approval, supervisor feedback, participant recruitment, or archive access. Add 15–20% to solo writing and analysis phases. Avoid applying a flat buffer to every task equally; the highest-risk, longest-duration phases on your critical path deserve the largest protection. Administrative tasks like formatting your reference list rarely need a buffer beyond an afternoon.
What should I do when I fall behind my thesis schedule?
Update your Gantt chart immediately rather than hoping to catch up passively — accurate tracking is more valuable than a flattering timeline. Next, determine whether the delay is on the critical path. If it is, choose one of three responses: reduce scope by cutting a planned data collection wave or appendix section; compress a writing phase by working from a tighter chapter outline; or negotiate a formal extension with your supervisor and department. Email your supervisor proactively — a brief early warning is far better than a silence followed by a crisis conversation.
Should I include supervisor review time on my thesis timeline?
Yes — supervisor review time is one of the most consistently overlooked milestones. A single round of chapter feedback typically takes two to four weeks depending on your supervisor’s workload, teaching schedule, and the chapter’s length. Budget for at least two full review rounds: one for a first draft and one for the revised version. Making supervisor feedback a named milestone on your Gantt chart forces both you and your supervisor to treat it as a scheduled event rather than an open-ended process.
Should I share my thesis Gantt chart with my supervisor?
Sharing your timeline with your supervisor is strongly recommended. It sets shared expectations about upcoming deadlines, gives them advance notice of when you will need feedback, and creates a natural structure for your regular supervision meetings. A Gantt chart shared as a Google Sheet or PDF at the start of the academic year, and updated monthly, also signals professional project management skills — something supervisors value and that reflects well in progress reviews and upgrade assessments.
Write your thesis with AI
Structure, draft, cite, and format your thesis faster with Tesify’s AI writing tools, automatic bibliography, and plagiarism checker. Free to start, no credit card required.






Leave a Reply